Matt Stoller is a fellow at the Roosevelt Institute. You can follow him at http://www.twitter.com/matthewstoller.
The big economic strategy for the next term of whoever is Presidenti is essentially, “turn those machines back on”. It’s fracking to replace cheap oil and a new real estate bubble in housing. Essentially, the idea is to turn America into more and more of a resource extraction economy, or a petro-state. If American politics seems more and more oligarchical, that’s because the American political system is beginning to reflect the Middle Eastern oil states its economic investment implies it should. Here are a series of charts explaining what is going on.
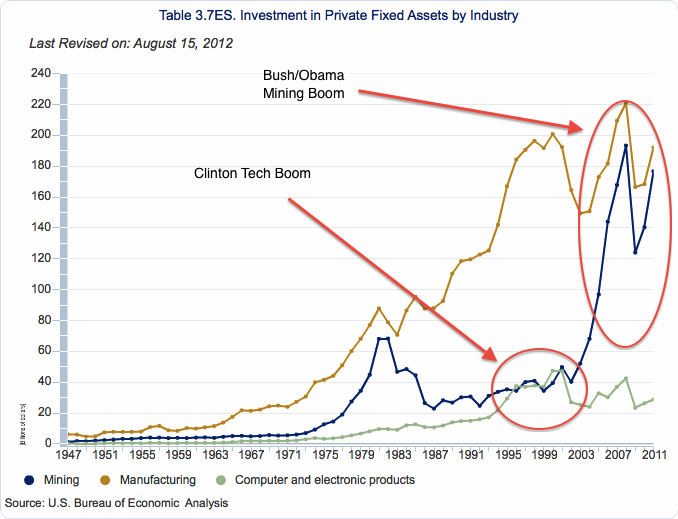
First, this is data showing investment in various investment sectors.
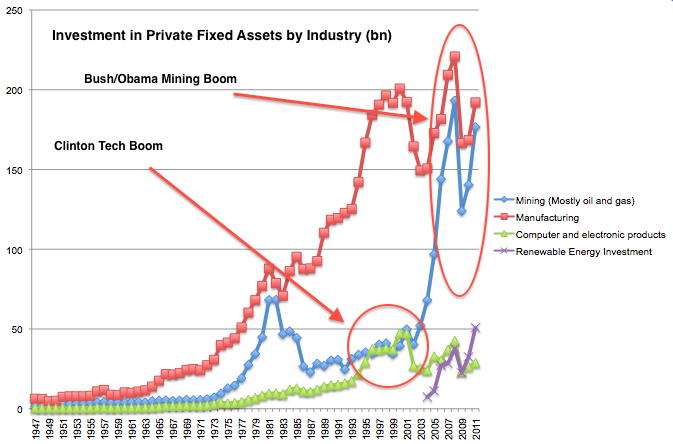
American politics looks increasingly like a petro-state, and this chart shows why. In the 1990s, particularly the late 1990s, the Clinton economy showed parity between manufacturing of computers/electronic products and mining (mostly oil and gas extraction). The Bush economy, starting in 2003 when the invasion of Iraq went sour, saw enormous hockey stick like investment in fracking, tar sands, and other types of extractive mining. Technology investment showed a slight decline. Obama by and large has sustained these trends.
And what of renewables? I took data from the United Nations Environmental Programme (UNEP) “Global Trends in Renewable Energy Investment 2012” and threw them into the chart. Renewables are that small purple line in the bottom right-hand corner.
What you see is that renewables are increasingly rapidly, from a small base, during both the Bush and Obama administrations. While people associate the “green economy” with Obama, the actual facts show that both Bush and Obama are part of a fracking/tar sands/green energy base. In fact, in Bush’s second term, from 2005 to 2008, renewable investment more than tripled, from $11.2B to $37.7B. In Obama’s first term, renewable investment has more than doubled. The data for the fourth year of Obama’s term hasn’t come out, but if you back out the fourth year of Bush term two, it still is an unfavorable comparison for Obama. Bush raised renewable energy investment by two and a half times, Obama a bit more than double (2.25 times). One could make the case for Obama by saying that there was a financial crisis he had to deal with, and that renewables are at a higher level of pre-crisis investment than mining is. I’m sure there are lots of ways to slice this data up. But one thing one can’t argue is that Obama has pursued an economically transformative strategy. Or rather, if you do make that argument, you’d then have to start saluting the greenest President we’ve ever had, George W. Bush.
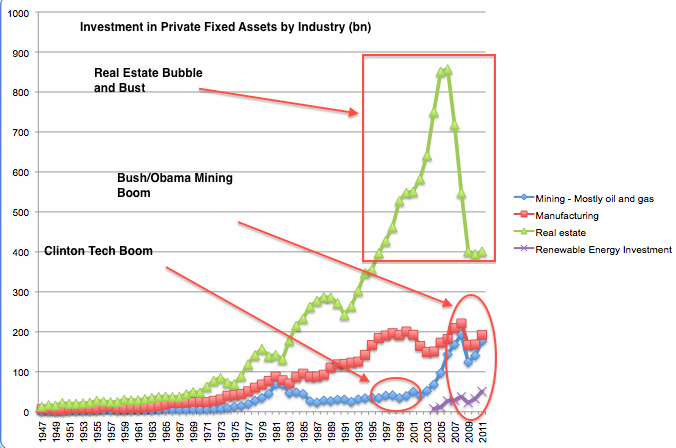
Regardless, the macro trend is clear. Both Bush and Obama pursued an “all of the above” energy policy, which for Bush included a very big dry hole – the invasion of Iraq. So what was the big difference between the Bush and Obama economies? Let’s add real estate investment into the chart, removing computers so as to make the chart less confusing.
And there we go. It’s all about a giant real estate bubble, stretching all the way back to the mid-1970s Carter era, but really picking up steam during the Clinton era and supercharging into the Bush period. You’ll notice three downturns in real estate investment since the 1970s, and all of them coincide with the loss of the incumbent party’s Presidential candidate (Carter, Bush I, McCain). The political lesson is, sustain property values and real estate investment or you are out on your ass.
With Obama, the cycle is broken – real estate is just not reinflating. And that $450 billion a year of lost investment isn’t being replaced with anything close to what would be necessary to employ all those people again. That massive hole in investment represents unemployment, idle resources, but most of all, a lost opportunity to restructure our economy.
UPDATE: Over email, Barry Ritholtz said that my data doesn’t include enough of the tech industry. I used as an imperfect proxy for the tech economy electronics manufacturing, which is essentially the manufacture of anything that has an integrated circuit in it.
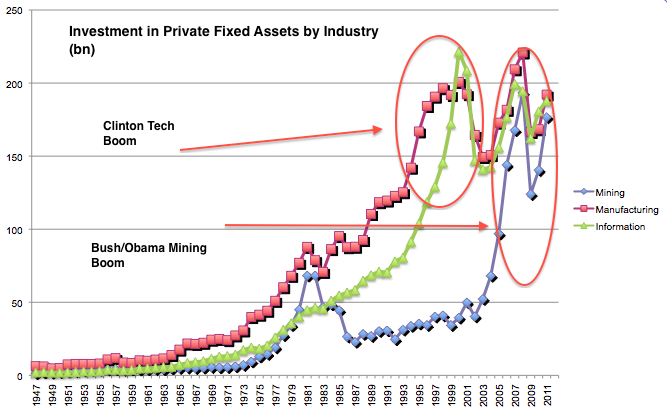
I’ve redone the chart, taking electronics manufacturing as a base and adding “information industries”, which includes book publishing, movies, broadcasting, newspapers, software, data processing, radio and telecom. This is also not a perfect proxy for the Clinton boom, since it combines movies and books with technology. You can find a list of industry classifications here and BEA data here.
This new chart doesn’t really change most of the macro-trend analysis. It does suggest the information sector was even more dominant during the Clinton boom.


Manufacturing is much higher than I would think, and generally trending upwards, also in defiance of what I had thought to be recent history. Does “investment in manufacturing” include, for instance, Apple’s construction of factories in China?
Wait, I don’t understand these charts. Are they indexes or do they show absolute amounts in billions? What’s the (bn) in the titles?
bn : for billion dollars , (units of a billion dollars).
Billions of nominal or real dollars?
I know they look dramatic, but a better historical indicator would be to compare them to GDP or perhaps relative to the stock of capital for each type.
My guess is that oil/gas are depreciating at a faster rate than other types of capital stock and that could partly account for the increases in investment.
Certainly not a good sign, however you look at it.
It’s called the FIRE sector for good reason. RE is a prime source for collateralized lending, even if such “investment” is really just extraction of implied land rents rather than any contribution to improved productivity and economic surpluses. But then that just gets to corporate globalization and the off-shoring of production, which leaves little to invest in domestically, even as wage incomes stagnate for the very same reason. When financial arbitrage operations via FX markets and borrowing cheap and long from abroad to re-invest at higher returns abroad become the main industry of the country, then why shouldn’t the “exorbitant privilege” lead to mal-investment and a bubblicious economy?
Friends;
Well, well. If the real estate sector returned to rough parity with the other sectors, say, pre-1973 levels, we can expect a roughly 50% drop in nationwide housing values. Use whatever multiplier the collateralization wonks use for their fell purposes, and you have a rough approximation of just how bad it’s going to be. Sane managers would step in and redirect all that malinvested wealth. Which leads us to think…
Good point.
So what you’re suggesting, housing prices dropped to 1973 levels, is a return to the real value of real estate before its doubling post-1979. It’s also a return to the time when the determined effort to punish the working class for its labor militancy began with the stifling of dissent and wage stagnation.
These sorts of comparisons are better made in terms of %GDP rather than dollars. Also if residential housing is brought in there should be some correlation to population growth and household formation. Pretty weak post IMHO.
Yes, because a 50% absolute drop in real estate investment in absolute dollars in three years was all about household formation. Idiot.
Super post. One wonders what it was the powers that be didn’t want us to see in the deliverables of Dick Cheney’s task force. Perhaps the most open administration in American history would open the books on that episode?
Oh ha ha ha. What am I thinking.
It’s a depressing picture. The same pattern’s repeated in the UK, though it’s much harder to get reliable stats. In essence the demand generated by a grotesque housing bubble has collapsed, and the confidence fairy is nowhere near making up the difference. Meanwhile the public sector is under attack, and every quarter brings worse results than the last.
Welcome to the downward sprial of austerity, the selctive disengamement of government from the economy and society(war and bailouts good, social welfare bad) and the inevitable decline into poverty and misery for large sections of the population.
there was a lot of cheering about the 15% bounce in new housing starts in september, the ±12.1% confidence level notwithstanding…but in checking the september payroll jobs total by selected industry, i found there were only 1100 more residential construction jobs than in august, and a decline of 13,700 home building jobs from a year ago…even worse, checking the unadjusted totals from the household jobs survey, we see 301,000 less employed in construction and related areas than a year ago, with an unemployment rate remaining intolerably high at 13.2%…so there really isnt anything to cheer about here yet…
I keep asking three questions. (1) How do you sustain a consumer based economy if you impoverish most of the population? At present, extractive economies are dependent on “first world” economies for their market. What happens when all economies are third world? (2) Does the American ruling class not believe in global warming? Or do they think they will survive it — for example, in armed and armored gated communities in Antarctica? (3) Do any of these clowns have any idea how complex and interdependent modern society is and thus how fragile?
Will it matter this quarter or next? No? Well then, we won’t worry about it now.
Great post Matt, if depressing. Perhaps a future post might speculate on how to apply that missing 450B investment in a way that wouldn’t be blowing another bubble? Can there be an infrastructure bubble?
Sure, the 1845 Railway Mania in England was one. However, that was a private enterprise affair, based on the speculators believing that their investments would get them a high return with no risk. I don’t think there can be such a thing as a public investment mania and crash.
I believe the “Clinton Tech Boom” arrow in the last chart is pointing to the incorrect series. It’s pointing to mining (incorrect)rather than manufacturing (correct).
And the prescription is… austerity for the many and bailouts for the few. All in the name of “trickle down prosperity,” an oldie but a goody that has even attracted the “new left,” which is to say the “old right.” Penance I say! The debtors must be forced to recant and pay for their financial sins! To the military with the lot of them! Good bullet stoppers are always a prized commodity.
Dear NAEFROH;
(Your moniker sounds vaguely Scots.)
We live in a Deep South university/military town. If you live near a similar place, do wander around the place and look, really look, at the ‘class’ of people wearing their BDUs on the street. Mainly young, vaguely lower ‘class,’ and most acting as if this is their ‘calling in life,’ earnest and serious. We are observing the transformation of a ‘class’ into a ‘caste.’ The American ‘Founding Fathers’ were leery of a standing army for very good reasons.
Funny how the new (and apparently permanently) poor embrace their fate, isn’t it? Something to do with the Warrior ethos, perhaps? Gun culture is apparently quite intoxicating. Maybe a NewAgeSociologistForRentOrHire can explain it one day. Rest assured, the MoneyMasters will revel in the fact of it, explainable or not.
Matt:
Perhaps it’s just my computer, but I’m getting an Error 404 with the link to “resource extraction economy”.
There may have been a housing boom since the 1970s but this did not become a bubble until after 1997 when housing prices really begin spiking upward.
http://www.standardandpoors.com/servlet/BlobServer?blobheadername3=MDT-Type&blobcol=urldocumentfile&blobtable=SPComSecureDocument&blobheadervalue2=inline%3B+filename%3Ddownload.pdf&blobheadername2=Content-Disposition&blobheadervalue1=application%2Fpdf&blobkey=id&blobheadername1=content-type&blobwhere=1245341034827&blobheadervalue3=abinary%3B+charset%3DUTF-8&blobnocache=true
(page 2) or just look up Case-Shiller on wiki.
Assigning much, if any, of the tech and commodity booms to presidential policy is a bit of a stretch. In particular, the commodity boom long cycle theories attributed to Kondratiev/Schumpter and more later popularized by Jim Rogers, predict a cycle of about 17 years. The resource extraction boom has been primarily fueled by BRIC developing economies. With a starting date of 98/99, the boom is getting a bit long in the tooth. Presidential policies will have little impact on the upcoming slowdown in commoditiy demand.
Outside of Nixon in 1972 and WTO agreements, what recent Presidential or Congressional policies had much influence on the infrastructure development of China and the subsequent commodity boom? Clinton/Bush/Obama were spectators, not drivers, of tech and commodity growth. Like all politicians, they take credit for the upside of the boom and blame the bust on their predecessors.
Regarding energy, increased resource extraction is a showcase of macro capitalism at work. The increase in supplies have been hugely driven by new extraction techonologies. Without major improvements in the ratio of energy input to energy output, market prices would need to be stratospheric to justify the development of new properties.
About the only area where Presidenial and Congressional policies have been extremely influential is in the finacialization of the economy. The Real Estate part of the FIRE economy ended in a bust and I suspect the Financial and Insurance industry will have the same unhappy ending.
Matt,
I was rather taken aback by the hockey stick appearance of the charts you’ve presented. I sought out info on how you’d corrected the charts for inflation or in other words, have these chart been normalized to a constant dollar value for a given year? I suspect not, because I’m an old geezer and I can assure anyone that a vast amount of the nation’s wealth flowed into manufacturing assets from 1947 to the mid- 1970s and this is simply not reflected in your charts. In comparison, since NAFTA and the free trade disease struck the U.S. our manufacturing base is rotting and the charts would mislead a visitor from Mars that exactly the opposite is occurring.
Alternately, one trend in the manufacturing industries has been to hyper-capitalize U.S. based manufacturing with massive automation schemes which ruin employment opportunities for the masses. Is this what is being reflected in your charts regarding manufacturing?
Is oil refining part of the manufacturing complex? If so, can this be reflected as a separate chart item? The reason I suggest this is because there has been a planned withdrawal of capacity in the U.S. for the past 15 years or so. Which would mean investment in the refining sector certainly would not show a hockey stick form on the basis of constant dollar accounting.
Thanks for any clarification.
It’s NAICS industry classifications via the BEA.
http://www.osha.gov/pls/imis/sic_manual.html
That doesn’t answer my question as to the normalization of the dollar values in the charts. Let’s drop this. You needn’t concern yourself further about my inquiry.
***
Here’s a couple of chart posts I’ve put up recently that I feel are far more explanatory of the odious and inequitable situation we find ourselves in at this late stage of feral capitalism in terminal decline:
http://www.occupybendor.org/news.php?tag=charts
One rumor going around is that Obama will make a executive order that would essentially “ending” NAFTA and other “trade agreements” which is why financiers are going so hard against him.
It makes sense. Obama seemed to be the choice by this time last year in terms of big money, then something changed last spring.
This would have major impacts.
The Rage, have you listened to Romney’s take on China?
If there’s one candidate who’s more likely to revoke NAFTA, it’s Romney, by a comfortable margin.
For all his faults, on trade, Romney’s much more preferable to the working class than has been President Obama.
Re: “If there’s one candidate who’s more likely to revoke NAFTA, it’s Romney, by a comfortable margin.”
Your sentence is both preposterous and delusional. Or else you are simply a liar like Romney.
Absolutely absurd claim.
http://www.foxnews.com/politics/2011/10/21/obama-signs-3-trade-deals-biggest-since-nafta/
And don’t forget:
http://hotair.com/archives/2008/02/29/obamas-nafta-double-talk-confirmed-ctv/
Why would either Romney OR Obama seek to “end” or even “modify” NAFTA or any other Free Trade Agreements? Don’t they both believe in Free Trade Globalizationism?
Isn’t Obama directing his subordinate goverminions to negotiate a “Trans Pacific Partnership” in secret with Congress expected to Ratify whatever it is so Obama (or whomever) can sign it? Didn’t Romney equally call upon Congress to ratify the TPP for President Whomever to sign just as soon as Congress ratifies it?
And either one of these Upper Class Warriors is going to “change” or “end” NAFTA? Or any other FTA or free trade law? I think not.
Matt…Your last graf sums things up pretty well:
“And that $450 billion a year of lost investment isn’t being replaced with anything close to what would be necessary to employ all those people again. That massive hole in investment represents unemployment, idle resources, but most of all, a lost opportunity to restructure our economy.”
It reminded me of a blog post I wrote awhile back advocating an alliance between proponents of Modern Monetary Theory (MMT), sustainable bottoms-up economic growth, and a “get the money-corruption out of politics” strategy a la Larry Lessig. I think the first two can get the “economics” right, while the latter is necessary for “getting the economics right” to have any practical impact on policy.
With the recent passing of my favorite presidential candidate, Barry Commoner (Citizens Party, 1980) amidst today’s sad sham of a presidential campaign, my gut tells me some sort of “emerging” political force is needed to challenge the deeply entrenched inertia. But my head doesn’t see much of a path, beyond the general thoughts reflected in my blog post.
http://evolvinghumansystems.com/2012/06/03/mmt-the-new-economy-movement-a-macro-micro-marriage/
In any event, it’s good to see you writing here at NC.
“With Obama, the cycle is broken – real estate is just not reinflating. And that $450 billion a year of lost investment isn’t being replaced with anything close to what would be necessary to employ all those people again. That massive hole in investment represents unemployment, idle resources, but most of all, a lost opportunity to restructure our economy.”
In 2008 I was so far gone that I thought Obama understood all this. We are instead doubling down on disaster. To use Obama’s metaphor, the GOP ran the car off the road and into the ditch and Obama came along to … put the same crappy car back on the same road to nowhere. The Green New Deal from Jill Stein and Green Party is the only platform I’ve seen that even acknowledges the real problems we face.
We are all, Petro States.
You should look into the ExportLand Model, Matt. It’s pretty basic.
Each country has a production line for oil, and a consumption line for oil. When the production line exceeds the consumption line, you’re a net oil exporter. When the consumption line exceeds the production line, you’re a net oil importer.
Each model is different, but the general trend is, consumption lines are rising (often exponentially –Saudi Arabia, India, China, Egypt), while production lines are falling (often exponentially –the UK, Mexico, Norway, Egypt).
http://mazamascience.com/OilExport/
Ah, Egypt, a classic example of how quickly the ExportLand Model can wreak havoc on your … what, your economy, your political structure, your ability to feed your population in the very near future?
The double exponential function. Exponentially increasing consumption meets exponentially decreasing production. Lines converge and then cross, often faster than you can blink.
That’s what happened to Egypt. One day, it’s a net oil exporter, using it’s oil revenues to subsidize food to feed it’s exponentially growing population, the next day it’s a net oil importer, using … what, loans from IMF, to pay for oil so it can … what, watch it’s population starve because it can’t afford both Peter and Paul?
Become another hungry debtor nation being raked over neo-liberal coals, that’s the only good option for Egypt.
And, if you think about it, without rapid “change,” it will happen to everybody. It’s a mathematical certainty.
Even Saudi Arabia. Look at their black line.
http://mazamascience.com/OilExport/output_en/Exports_BP_2012_oil_bbl_SA_MZM_NONE_auto_M.png
The black line is causing so much panic in the Land of the Cheapest Oil, the Kingdom has just announced, they’re energy inputs will be 100% green by 2030.
Oh, the irony!
Matt, what’s the source for the RE investment line in the final chart. I’ve never seen a sector-by-sector comparison like this. It’s fascinating.
Yo, Yves. Got to update you footer before 2013 comes.
The housing bubble dwarfs them all for malinvestment. We are still suffering from it.
What would a restructured economy look like?
Though real estate has experienced a big drop during obama’s term, I am willing to give him a chance. I think he is very dedicated and with enough time he could help this country get back on track.
Perhaps real estate will sink all the way back down to the natural low from which it should never have risen to begin with. Perhaps the bubble-rise in house prices was the crisis and the bubble-pop fall in house prices is the solution to the price-rise crisis.
Perhaps house prices will crash all the way down to the level where even I might buy a house some day.
I think it should be pointed out that a lot of the investment in renewables is for ethanol, which isn’t exactly an energy source that is particularly sustainable in the long term, either. And it doesn’t help much with climate change.
It may not even be an energy “source” at all. It may be a pure energy “sink”. If so, “corn ethanol” will come to an end when there is no oil left to be sunk into growing corn for “ethanol”. Corn “ethanol” may disappear even sooner if corn can earn more money sold as food than as fuel.
What mining boom? …extraction economy? I think what’s happening here is a consequence of the shifts in investment. Capital is flowing into the gold market, creating another artificial market in gold mining, creating large investments in precious metals mining – all over the world, not just the US. But the number of mines opening in the US is quite small. The US is not all that friendly to mining interests, as nations go. There’s boomlets in N. MN for Pt/Ni and for REMs in CA. That’s all I have seen in new mining activity. So, given in $bn, there’s a huge capital investment in precious metals and their mines. That hardly makes us a resource extraction economy. My guess is that what these charts show is investment of US capital in mining everywhere, i.e. mostly elsewhere. Compare US activity in mining with that of the Arctic nations. That’s where the new action is, certainly where the new action in diverse resources is located. Look at new projects and prospects in the Canadian arctic. New diamond mines, a huge iron mine in northern Baffin Is., rare earth prospects in northern Que., activity in the Labrador trench. Greenland is starting to open up. What about Siberia? I don’t know about that. Labor is in high demand in mining in Canada; thousands of China miners are being imported there. I too worry about the failure of US capital to invest in true innovation. That’s really unhealthy in a society that’s given up on manufacturine. If this doesn’t change soon, look (I hope) for gov’t to step in.
We will not forget. They tried to take our? peace of mind but we held on. No one can ever take someones sanity. Thoe who died will be remembered and those who helped but didn’t come out will be praised for their heroism. We will not forget. Never.