By C.P. Chandrasekhar, Professor of Economics, Jawaharlal Nehru University, New Delhi and Jayati Ghosh, Professor of Economics and Chairperson at the Centre for Economic Studies and Planning, Jawaharlal Nehru University, New Delhi. Cross posted from Triple Crisis
Much has been made of how there has been a substantial shift in the balance of economic power between the advanced capitalist economies (or the “North”) and some economies of the global South. It is true that very recently the hype surrounding “emerging markets” has died down, as international capital flows have swung away from them and many of them have shown decelerating growth or even declines in income as global exports fall. Nevertheless, the feeling persists that – in spite of a supposedly resurgent US economy – the advanced economies are generally in a process of relative decline, while the developing world in general and certain economies in particular have much better chances of future economic dynamism. And this process is generally seen to be the result of the forces of globalisation, which have enabled developing countries, especially some in Asia, to take advantage of newer and larger export markets and improved access to internationally mobile capital to increase their rates of economic expansion.
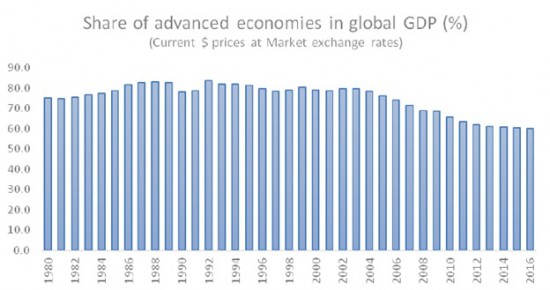
Chart 1

But how significant has this process actually been?
In fact, there has definitely been some change over the past three and a half decades, but it has been more limited in time than is generally presumed. Chart 1 plots the share of the advanced economies in global GDP in current US dollar prices, calculated at market exchange rates. (Data for all the charts have been taken from the IMF World Economic Outlook October 2015 database.) This shows that the share of advanced economies declined from around 83 per cent in the late 1980s to around 60 per cent now, which is really quite a substantial decline. However, the bulk of this change occurred in a relatively short period: the decade 2002 to 2012, when the share dropped from 80 per cent to 62 per cent. The periods before and after have shown much less variation, and indeed, the share seems to have stabilised at around 61 per cent thereafter.
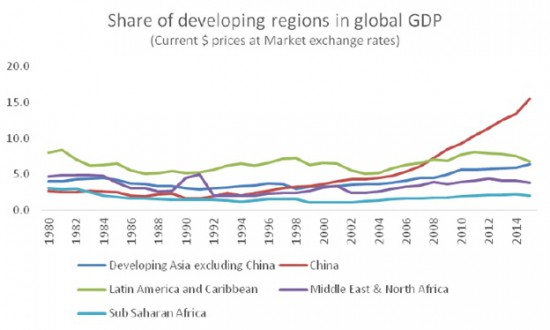
Chart 2 looks at the obverse of this process – the change in the shares in global GDP of the major developing regions, with China treated as a separate category on its own. This shows a somewhat more surprising pattern, because it indicates that the dominant part of this shift is due to the increase in China’s share, which rose from around 3 per cent to more than 15 per cent. Once again, this happened essentially during the decade after 2005, when the share of China in global GDP at market exchange rates jumped by more than ten percentage points. Indeed, the change in China’s share alone explains 87 per cent of the entire decline in the share of the advanced economies in the period 1980 to 2015. Considering only the last decade, that is after 2005, the relative increase in China’s GDP accounts for a slightly lower proportion of the change, at 67 per cent – which is still hugely significant.
Chart 2

The change in shares of other regions provides some interesting insights. The Latin American region experienced a medium term decline in relative income share over the 1980s (the “lost decade”), recovered somewhat in the 1990s before declining once again in the late 1990s and early 2000s. The global commodity boom of 2003 onwards was associated with a revival in the region’s economic fortunes and the share of the region increased from 5 per cent in 2003 to more than 8 per cent in 2011, but thereafter it has stagnated and fallen with the unwinding of that boom.
The income share of the MENA region (Middle East and North Africa) appears to be very strongly driven by global oil prices, with sharp peaks in period of high oil prices and stagnation or decline otherwise, and over the entire period there has been a stagnation in income share rather than any increase. An even more depressing story emerges for Sub Saharan Africa, which showed decline in income share for a prolonged period between 1980 and 2002, and subsequently a slight recovery (from 1.1 per cent in 2002 to around 2 per cent in 2012 and thereafter) that was still well below the share of more than 3 per cent in 1980.
The only developing region that shows a clear increase is developing Asia, which in this chart excludes China to clarify the respective significance of both. But the increase in the income share of this region (minus China) has been much less marked than that for China, and most of it occurred after 2002, as the income share rose from 3.5 per cent in 2002 to 6.4 per cent in 2015.
Chart 3

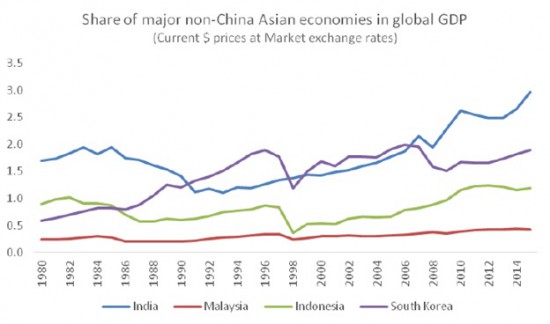
Chart 3 indicates the changes in shares of the largest Asian developing countries other than China. It is evident that in terms of increasing share of global GDP, India has been the most impressive performer over the past decade in particular, with its share increasing from 1.8 per cent in 2005 to 3 per cent in 2015. Note, however, that this is still tiny in comparison to China, and indeed, just the increase in China’s share over that decade has been more than three times of India’s aggregate share. South Korea’s share has also increased, mostly over the 1980s and early 1990s, while Indonesia’s share increase occurred mostly during the commodity boom of the 2000s.
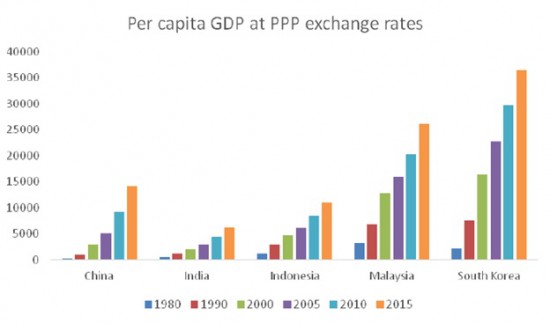
In terms of per capita GDP, however, the Indian performance looks much less impressive than those of the major Asian counterparts. Interestingly, even the Chinese experience appears not as sharply remarkable, although still hugely better than that of India. Chart 4 tracks the movements of per capita GDP, measured now in Purchasing Power Parity (PPP) exchange rates rather than market rates. There are numerous problems with the use of the PPP measure, but for current comparative purposes it does provide some kind of indicator. This shows that by far the most impressive performance in terms of increasing per capita GDP has been in South Korea, followed by Malaysia. India shows the least improvement among these five economies, despite its apparently more rapid increase in terms of share of world GDP in the last decade.
Chart 4

Overall, therefore, while the world economy has changed over the past three decades, this change should not be exaggerated for most developing regions, or even for most countries in what is apparently the most dynamic region of Asia.


That China accounts for almost all of the shift isn’t so much new news, as repeatedly memory-holed news. It’s not surprising that it keeps going down the memory hole, as it completely destroys the case for the neoliberal policy consensus that China flouted over that period.
Every talking head who extolls the Washington Consensus for “lifting the poor of the world out of poverty” is a stone cold liar. The real goal of “globalization” isn’t general prosperity, it’s the continued domination of “us” over the “lesser breeds”.
It is the bringing the advantages of the third world to the others.
Why should we get paid more than them?
Look at all the billionaires that were lifted out of poverty in these countries.
Why should we get paid more than them?
Our useless eaters get much more than their useless eaters,
PPP is a scam. To someone displaced here, it matters zero that the worker in Mexico, for example, can get by on one tenth the wage that used to be payed to someone here.
Look at all the billionaires that were lifted out of poverty in these countries.
Look at the billions that did all the lifting. They still make as close to zero as you can get.
Imagine for a moment, Tim Cook does the underground boss thing and sneaks himself into the Foxconn factory for a spot on the assembly line for a month. If he could get by the first few days and not scrap too many phones, and become proficient and last the whole month at 60 hours a week, what do you think his pay for this work would be? Would you like your monthly pay to match it?
I wasn’t being entirely serious, but my point was.
Other people work for sweet FA and so why shouldn’t you?
This is the question technocrats have been tearing other peoples hair out for the last 40 years
Because…free markets have been the historical engine of common wealth…who cares if all the evidence points to the contrary.
I recognise the inversion of the pyramid of life in my little comment.
I do not believe the overclass are struggling manfully to support the rest of us through their own, thankless philanthropy.
“Us” being the rich bi-coastal elite DemParty liberals like the vile filth which vote for Pelosi, and the “lesser breeds” being all the millions of jobless ex-thingmakers who lost their jobs in the Clinton-Pelosi Free Trade bonfire of the industries?
Thanks to multinationals being effectively stateless due to tax arbitrage games, who actually has global economic power but the corporations themselves?
In the end, the States do, because the corporations need the military and other coercive power of States to enforce contracts and extract their pounds of flesh. The USA has the world largest GNP (or GDP, I can never keep the two straight although when I was a kid in the 1970s, it was GNP) and the world’s most destructively powerful military (it may not be able to “defeat” you, but it can make you wish you had never screwed with Uncle Sam). GNP backstops military power and other nasty forms of coercion. Poor countries simply can’t throw their weight around effectively in what is still an international jungle. Rich ones can.
It’d be interesting to see what Chart 2 looks like if measured in PPP rather than at market rates. It might demonstrate how much the structure of global markets effects the valuation of production, and how not-flat the globalized economy is. I’d like to see measures other than GDP as well, especially industrial commodities, capital goods, automobile, and shipping production. When it comes down to it where does the industrial capacity actually reside, and how has this shifted over the years?
Since April 2011 — nearly five years ago — commodity prices have fallen a harrowing 48%, measured by the CCI-TR index. Over the same period, the US dollar index (DXY) rose almost 30%.
These two trends contributed to the recent flattening out of developing economy gains in GDP share, measured in USD.
Commodities are sufficiently depressed that on a valuation basis, a turnaround might be expected, and indeed may already have commenced in the CCI’s 5.7% rise from its 15 Jan 2016 low.
In a more favorable global macro environment, developing economies likely will gain more relative GDP share over the next five years than they did in the headwinds of the past five.
That’s a logical premise and it implies that developing countries, with a sparse and elitist infrastructure, will be the ones to do big new infra that promotes equality and stability, but do not waste their opportunity to balance their economies by using old ideas about investing in all the mistakes and boondoggles of neoliberalism… etc. This opportunity is part of a global power shift which demands environmental cooperation. Just personally hoping all the carpet baggers go directly to jail.
The obamacare mandate will go down as the straw that broke the camel’s back, and Chinas printing will reverse, with scant more to show for itself than Japan’s push behind the internet.
Pushing government religion is one thing; mandating participation is another.
I chanced at nakedcapitalism after pointed here by Wim Grommen on his 2014 article, in response to my tweet about Tata Steel decision to shut its British Steel division. Maybe as Prof. Chandrasekar and Ghosh say and probably prove, global eco power has not yet significantly shifted to developing nations.
But even a small shift, like take over of British Steel/Corus by Tata Steel itself established by ‘concession’ from the British colonial masters, has enormous repercussions. In developing countries, losing a job and consequences is not yet economically significant (mostly) on families, because, the income levels between skilled and semi/unskilled are still not yet divisive enough to create such a huge divide. And of course joint family system and support where it exists helps.
Impact of a Tata Steel decision re British Steel would be far more in developed countries, than such a decision in developing countries. For e.g. Prof. Chandrasekar and Ghosh might analyse the impact of Tata Steel closing down British Steel operations, versus MicroSoft/Nokia shutting down its Chennai plant (which reportedly employed 6,600 people directly).
Coding quickly reveals the difference between what we think and say, largely shared mythologies, and what we do, which is why the 1/3 rule exists. Programmers aren’t the brightest bulb these days, subjecting themselves to illusions of power in a cubicle, and we live in an extortion economy at the end of an empire cycle, so the extortion gets embedded ever deeper into the black boxes controlling the lives of most. WS really doesn’t care, because it bets on the behavior of peer pressure, so we’ll ingrained by public education, and efficiently reproduced by public healthcare, all of which is now scripted, in a box few are willing to challenge, because to begin we must challenge assumptions embedded in ourselves, while empire keeps increasing the artificial complexity consuming life.
The US tires of war in times of permanent war when winning is negated.
As a Government of Governments at the height of its powers, able to conduct economic war against any it wants, the grasp is a reach too far.
China has been winning in the private movement away from where its money is less free, same as Russians with temporary luck.
China, the corporation, can rename its companies & manipulate markets that are essentially matters of national security as in food.
Russian state companies have not followed the private individuals and it is only London & Wall Street looting in that part of the game.
Drugs & food are addictive.
Legalized Meyer Lansky financial engineering continues to weaken the ability of the US to maintain its US Petrodollar, as it needs to bolster the Fiat currency conceptual basis. Trust being a factor for the respect a fiat based currency requires as situations shift.
This would explain why President Obama explained away lack of prosecutions for the end of the fiction that Wall St. was at all real. Later there was a complaint made of further Lansky tools to the ally that is the UK over the Cook and Cayman Islands.
Only the Pakistanis and the North Koreans really really want to use their nukes.
Sanctions do produce the sneak attack as was demonstrated when Japan hit Pearl, so their application is either productive of a resolution as was Minsk, and the Russian win for Assad before the Saudis took a chance with their tanks.
The discussion was about power. War is a business, however there are limits to all markets for all things, except maybe bad ideas.
I am suggesting bombing with bags of popcorn to show power in a combined hard and soft way to keep the conflicts from ending in apocalyptic riot.
Power has a price.
FDR wanted to save capitalism using the exceptional tax, and the US had a moat, and made money.
Now it is literally about saving the world, which is where business is done.
Ghanaian economics for India asked the people to stop and resist the desire for more. It was to the British Empire what China was supposed to be to the US.
Finance as the major business of the educated classes showed gambling is weak compared to manufacturing then, and it is the same now for the US.
The real price is wisdom. Either pay it as a nation together, or lose separately and then wish for a home to return to.
The corporations got personhood. They think they are pretty smart. That AIG got reinsured by the little people shows they need to all up there act fairly, but the Greed index is higher than 70 percent.
-forgive me, it is late. “I saw the word power and responded.” Firesign Theater