Lambert here: Too bad about the Iraq thing. And Afghanistan. Anyhow, drones are soft, right?
By Andrew K. Rose, Professor of International Business, in the Economic Analysis and Policy Group, Haas School of Business, University of California, Berkeley. Originally published at VoxEU.
A nation’s hard power is based on its ability to coerce, while its soft power depends on the attractiveness of its culture, political ideals, and policies. This column shows that a country’s soft power has measureable effects on its exports. Countries that are admired for their positive global influence export more, holding other things constant.
Joseph Nye (1990) first discussed ‘soft power’ – a country’s ability to attract or persuade others to do its bidding. Soft power contrasts with a country’s ‘hard power’ or force (Nye 2004). Europeans pride themselves on their soft power; Americans tend to think highly of their hard power.
Whereas hard power – the ability to coerce – grows out of a country’s military or economic might, soft power arises from the attractiveness of a country’s culture, political ideals, and policies. It is by no means under government control. Nye considers hard power to stem from a country’s population, resources, economic and military strength, and the like. By way of contrast “[s]oft power is … the ability to attract, [since] attraction often leads to acquiescence … soft power uses a different type of currency (not force, not money) to engender cooperation – an attraction to shared values …” (Nye 2004: 6-7).1 Nye thinks of this as “…the ability of a country to structure a situation so that other countries develop preferences … consistent with their own” (Nye 1990: 168)
In recent research, I have taken advantage of a quantitative measure of soft power to show that a country sells more exports to other countries which perceive it to be a force for good, holding other factors constant (Rose 2015). These higher exports can be viewed as a carrot that rewards behaviour admired by others, symmetric to the sticks more commonly used in international commerce. A prominent example of the latter currently is the ‘Boycotts, Divestment and Sanctions’ (BDS) campaign currently being used by Palestinians against Israel. My results show that global behaviour perceived to be better/worse has a material effect on exports.
My point estimate is that a 1% net increase in soft power raises exports by around 0.8%, holding other things constant; being perceived as a force for good has a direct economic payoff. Succinctly, winning hearts and minds also wins sales. I find this effect to be relatively (but not completely) insensitive to a variety of robustness checks.
World Influence: The BBC/GlobeScan Measure
I am interested in whether importers change their observable behaviour when they perceive an exporter to be behaving better or worse in the world. My default measure is developed for the BBC World Service through its partnership with the international polling firm GlobeScan and the Program on International Policy Attitudes (PIPA) at the University of Maryland. Survey results are freely available online, along with the associated methodological details. Participants in a large number of countries (33 in 2006) are asked about their views about a smaller number of countries (eight2 in 2006, as well as ‘Europe’). Participants are asked whether they think the influence each country and Europe has on the world is mainly positive or mainly negative (other possible responses are ‘depends’, ‘neither, no difference’, and ‘don’t know’).3
These surveys have been conducted annually since 2006. Participants in a total of 46 countries have been asked about the influence of a total of 17 countries over the years; both sets are listed in an appendix, along with the number of observations available. All in, there are a total of 2,730 observations, with two variables concerning the global influence of one country as perceived by others – the percentages answering ‘mainly positive’ and ‘mainly negative’ (these do not usually sum to 100%). I construct a third variable by subtracting the negative from the positive perceptions; the difference is a measure of net perceived influence.
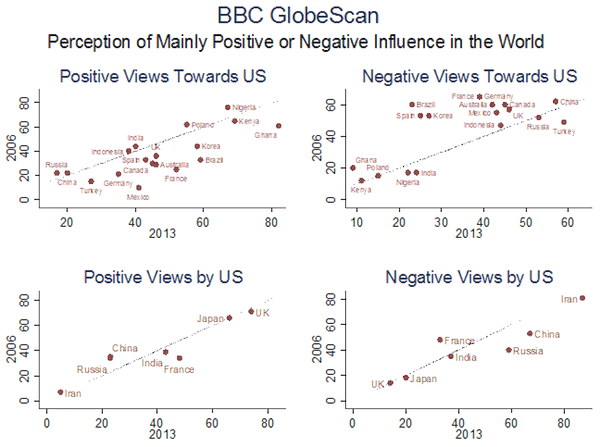
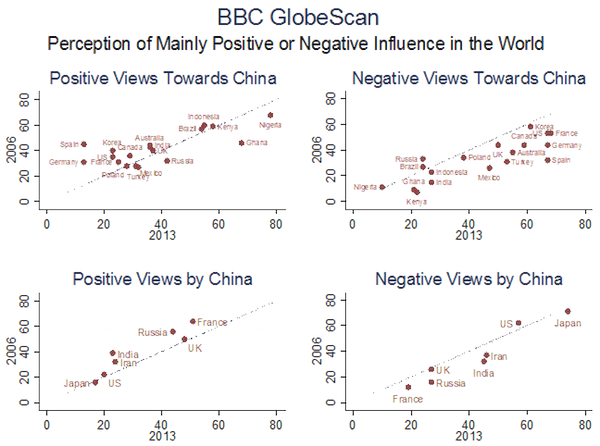
Figure 1 provides some concrete examples. Consider the top-left graph in Figure 1. This graphs positive views of American influence in 2006 (on the y-axis) against positive views of American influence in 2013 (on the x-axis). There are big differences across countries; in 2013, only 17% of Russians considered American influence mainly positive, in contrast to 82% of Ghanaians. Interestingly, there are also (smaller) changes over time for a given dyad (a 45° line is included in the graph). For instance, Mexican perceptions of America’s influence rose from being 10% mainly positive in 2006 to 41% in 2013, while French perceptions rose from 25% to 52% over the same period of time, and Brazilian from 33% to 59%. The analogous data for mainly negative views of the US are portrayed in the top-right figure. Here too, there is considerable dispersion across both countries and time. The two figures in the bottom part of the figure are analogous, but present data of the (mainly positive and negative) global influences of other countries, as perceived by the US. Figure 2 is the analogue for China.
Figure 1. Positive and negative views of and by the US in 2006 and 2013
Figure 2. Positive and negative views of and by China in 2006 and 2013
Measuring the Effect of Soft Power on Exports
I use a conventional data set and a standard ‘gravity’ model of international trade to account for other influences on bilateral exports besides soft power. My econometric model includes a comprehensive set of country-year fixed effects (one set each for the exporter and importer), which control for a host of influences on bilateral exports other than soft power.
For instance, any boost to American sales arising from the 2008 election of Barack Obama is taken out by the 2008 American exporter fixed effect; similarly, any effect on Egyptian imports arising from the 2011 Arab Spring is taken out by the 2011 Egyptian importer fixed effect. Anything that is specific to a country and a year – such as the size of its economy, population, culture, or military spending, for either the exporter or the importer – is accounted for by the fixed effects.
What is the additional effect on exports from x to y of the (mainly positive) global influence of x as perceived by y? The statistical estimate is an economically large elasticity of .5; a 1% increase in the exporter’s positive world influence, as perceived by the importer, is associated with a 0.5% increase in bilateral exports. This effect is statistically large; the robust t-ratio exceeds six and thus is different from zero at all reasonable confidence levels. The results from the other measures of world influence are consistent. An exporter perceived to be exerting more of a negative influence experiences exports that are lower by an economically and statistically significant amount. Consistently, the perceived net effect tabulated there is also positive, and statistically large.
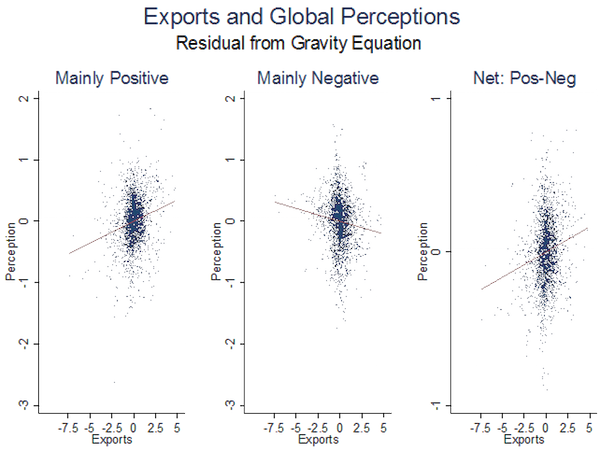
Figure 3 provides visual evidence of the effect of perceived influence on (log) exports. First, I regress log exports on all export determinants, except the effect of influence. Next, I regress influence on the same set of regressors. I then plot the influence residual (on the y-axis) against the export residual (on the x-axis). There are three different scatter-plots, one for each of the three measures of influence (log mainly positive, log mainly negative, and net), each with the corresponding least squares fitted line. The effect of influence is visible, though not overwhelming; the effect does not appear to be driven by outliers.
Figure 3. Influence and export residuals
Concluding Remarks
Countries that are admired for their positive global influence reap the benefit of higher exports, holding other things constant. This result is economically and statistically significant, reasonably (but not completely) robust to a variety of potential econometric issues, and seems intuitive. It may also be important; if the benefits of soft power include an unappreciated export boost, too little soft power may be generated. Countries like Iran, North Korea, Pakistan, and Israel that are maligned as a mostly negative influence in the world suffer lower exports than they otherwise would.
References
Nye, J (1990) “Soft power”, Foreign Policy, 80: 153-171.
Nye, J (2004) Soft power: The means to success in world politics, Public Affairs, New York.
Rose, A K (2015) “Like me, buy me: The effect of soft power on exports”, CEPR Discussion Paper 10713.
Footnotes
1 Nye writes: “Broadly speaking, power is the ability to affect the behavior of others to get the outcomes you want, and there are three basic ways to do that: You can coerce them with threats. You can induce them with payments. Or you can attract and co-opt them… The ability to establish preferences tends to be associated with intangible assets such as an attractive personality, values, institutions, and a vision that are seen as legitimate or having moral authority. If a leader represents a vision and values that others want to follow, it will cost less to lead. Soft power often allows a leader to save on costly carrots and sticks. Simply put, in behavioural terms, soft power is attractional power.’
2 China, Britain, Russia, France, The US, India, Japan, and Iran.
3 http://www.globescan.com/news_archives/bbc06-3/demoquest06-3.html


