Yves here. The post below is likely to stir up a great deal of controversy among Serious Economists, since it makes two important claims. The first is that countries experiencing liquidity traps suck other economies into them. This might give a whole new meaning to the idea of contagion. Second, having the reserve currency is not a hot place to be in a liquidity-trap-afflicted environment.
But as interesting as this discussion is, it also has the unfortunate effect of increasing the fixation with monetary policy. As Warren Mosler said via e-mail, another way to look at this paper is that it proves “Nothing more than insufficient deficit spending.”
By Ricardo Caballero, Professor of Economics, MIT, Emmanuel Farhi, Professor of Economics, Harvard and Pierre-Olivier Gourinchas, Professor of Economics, University of California, Berkeley. Originally published at VoxEU
On 11 August 2015, the People’s Bank of China devalued the yuan. Although modest in size, the devaluation signalled a turning point in China’s willingness to let the yuan appreciate, or remain stable, against the US dollar. On 22 October 2015, Mario Draghi signalled that the ECB was willing to adjust the “size, composition and duration” of its quantitative easing (QE) programme. In short, the ECB will soon be pumping more liquidity into a flagging Eurozone economy. The euro quickly fell 1.67% against the dollar. Many market analysts expect the Bank of Japan to expand its massive QE programme either at its late October meeting or in the near future, putting further downward pressure on the Japanese yen. Over the last 24 months, the dollar is up nearly 10% against a major currencies index of its trading partners. Against this background, the Federal Reserve postponed yet again the ‘normalisation’ of its monetary policy at its October meeting, a decision observers attribute in part to the appreciating dollar. Welcome to the global zero lower bound economy!
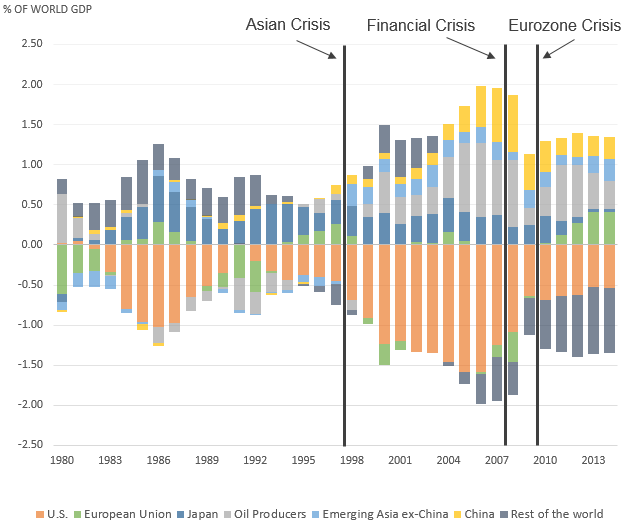
In Caballero et al. (2008a,b), we argued that the (so called) ‘global imbalances’ of the late 1990s and early 2000s (Figure 1) were primarily the result of the great diversity in the ability to produce safe stores of value around the world, and of the mismatch between this ability and the local demands for these assets. In particular, we highlighted the US as the main producer of (safe) assets, and China, oil-producing economies (especially the Middle East) and Japan as the main sources of demand for these stores of value. The growing global shortage of safe assets imparted a strong downward secular trend to world real (safe) interest rates for more than two decades. Capital flows acted as the propagating mechanism by which the asset-scarce regions dragged asset-rich regions’ interest rates down.
Figure 1. Global imbalances

Note: The figure shows current account balances as a fraction of world GDP. We observe the build-up of global imbalances in the early 2000s, until the financial crisis of 2008. Since then, global imbalances have receded but not disappeared. Notably, deficits subsided in the US, and surpluses emerged in Europe. Oil producers: Bahrain, Canada, Iran, Iraq, Kuwait, Libya, Mexico, Nigeria, Norway, Oman, Russia, Saudi Arabia, United Arab Emirates, Venezuela; Emerging Asia ex-China: India, Indonesia, Korea, Malaysia, Philippines, Singapore, Taiwan, Thailand, Vietnam.
Source: World Economic Outlook Database, April 2015 and authors’ calculations.
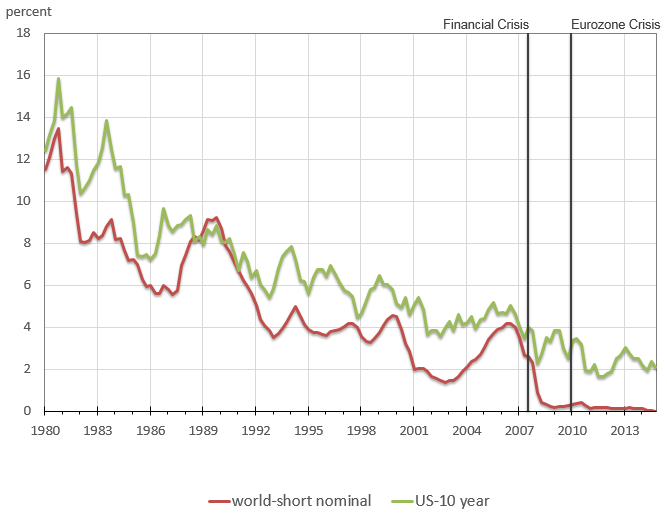
Much has happened since then. Following the subprime and European sovereign debt crises, we entered a world of unprecedented low natural interest rates across the developed world and in many emerging market economies. With natural rates so low, the equilibrating mechanism we highlighted in our previous work has little space to operate, since nominal interest rates are constrained by the zero lower bound (ZLB). Indeed, Figure 2 shows that global nominal interest rates have remained stuck at the ZLB since 2009. Yet the global mismatch between local demand and local supply of stores of value remains.
Figure 2. World nominal interest rates

Notes: The graph shows the large decline in nominal interest rates. Following the financial crisis, the world economy remains at the ZLB. World-short nominal: current dollar GDP-weighted average of G-7 3-months yields. US-long: annualised yield on 10-year Treasuries.
Source: Global Financial Database, World Development Indicators and authors’ calculations.
How does this global mismatch play out and shape global economic outcomes when global equilibrium real interest rates are extremely low? The importance of this question was illustrated vividly by the blog exchange between former Fed chairman Ben Bernanke and former Secretary of the Treasury Larry Summers in April 2015. While Summers (2015) argued that we may have entered into an age of ‘secular stagnation’, Bernanke (2015) replied that if the US entered into a persistent liquidity trap, capital would flow out of the US, depreciating the dollar and boosting US economic activity. In short, Bernanke argued that exchange rates and capital flow would prop up the US economy, at the expense of its partners.
In Caballero et al. (2015) we address this question systematically, with a simple and tractable framework. We ask: How do liquidity traps spread across the world? What is the role played by capital flows and exchange rates in this process? What are the costs of being a reserve currency in a global liquidity trap? How do differential inflation targets and the degree of price rigidity influence the distribution of the impact of a global liquidity trap? What is the role of (safe) public debt and government spending in this environment?
The main contribution of our recent work is to provide a simultaneous and coherent answer to these questions. In our model, once real interest rates cannot play their equilibrium role any longer, global output becomes the active margin: lower global output – by reducing income and therefore asset demand more than asset supply – rebalances global asset markets. In this world, liquidity traps emerge naturally and countries drag each other into them.
How do Liquidity Traps Spread Across the World?
Our benchmark framework is a perpetual-youth overlapping generations model with nominal rigidities, designed to highlight the heterogeneous relative demand for and supply of financial assets across different regions of the world. Given the nominal rigidities, output is aggregate-demand determined as soon as the global demand for financial assets exceeds their supply, at the ZLB.
We first show that in a stationary world in which all regions of the world share the same preferences for home and foreign goods (i.e. without home bias), unitary trade elasticity, and financial markets are fully integrated, there is an all-or-nothing result: either all regions experience a liquidity trap, or none. In other words, financial integration can either prove a bane, as it lifts a country off of the liquidity trap it would otherwise experience under financial autarky, or a curse it if pulls a country into a global liquidity trap it would otherwise avoid under financial autarky.
Home bias and non-unitary trade elasticities can attenuate but not overturn this result. More importantly, the relative severity of these traps varies depending on a region’s relative supply of and demand for financial assets, and on the level of the exchange rate. We turn to these next.
What is the Role Played by Capital Flows in This Process? A Metzler Diagram in Quantities
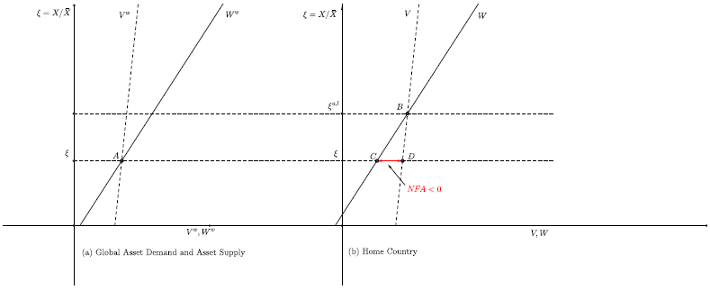
We characterise global imbalances in terms of a Metzler diagram in quantities that connects the size of the global liquidity trap and net foreign assets (and current accounts) positions to the size of the liquidity traps that would prevail in each region under financial autarky (Figure 3). This is analogous to the traditional analysis outside of a liquidity trap, where the world equilibrium real interest rates and net foreign assets (and current accounts) positions are connected to the equilibrium real interest rate that would prevail in each region under autarky. This analysis shows that when a region’s autarky liquidity trap is more severe than the global liquidity trap, that country is also a net creditor and runs current account surpluses in the financially integrated environment, effectively exporting its liquidity trap abroad. Other things equal, a country experiences a more severe liquidity trap than average when its ability to produce financial assets is low relative to its own demand for these assets. For the same reason, in this environment, a large country with a severe asset shortage can pull the world economy into a global liquidity trap through its downward pressure on world equilibrium interest rates.
Figure 3. Metzler diagram in quantities

Notes: Panel (a) reports global asset demand (solid line) and global asset supply (dashed line) as a function of Home output gap x, for a given value of the exchange rate. The intersection (point A) determines the size of the domestic liquidity trap for a given nominal exchange rate necessary to equilibrate global asset markets. Panel (b) reports home asset demand (solid line) and home asset supply (dashed line), as a function of the domestic liquidity trap x. The two curves intersect at the autarky liquidity trap xal (point B). Home is a net debtor (NFA<0) and runs a current account deficit (CA<0) when its liquidity trap is more severe than under financial autarky.
What is the Role Played by Exchange Rates in This Process?
Our model uncovers a fundamental degree of indeterminacy, related to the seminal result by Kareken and Wallace (1981) that the nominal exchange rate is indeterminate in a world with pure interest rate targets. This is de facto the case when the global economy is in a liquidity trap, since both countries are at the ZLB. In our framework, however, this indeterminacy has substantive implications since money is not neutral. Different values of the nominal exchange rate correspond to different values of the real exchange rate and therefore different levels of output at home and abroad. This means that, via expenditure switching effects, the exchange rate affects the distribution of a global liquidity trap across countries. This implication creates fertile grounds for ‘beggar-thy-neighbour’ devaluations achieved by direct interventions in exchange rate markets.
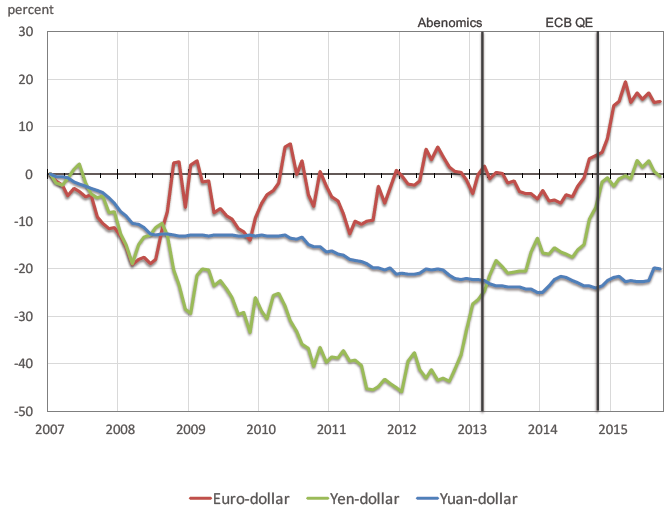
Thus, our analysis speaks to the debates surrounding currency wars. The recent exchange rate depreciations in Japan and the Eurozone fit well within this mechanism, as illustrated in Figure 4, and so does Switzerland’s currency floor during the height of the European crisis and its subsequent removal. Also, the recent Chinese slowdown is consistent with a country that has a structural shortage of safe assets, but whose currency is factually ‘pegged’ to an appreciating US dollar.
Figure 4. Global exchange rates

Note: The figure reports the cumulated relative depreciation (positive) or appreciation (negative) against the U.S. dollar, since January 2007.
Source: Global Financial Database.
What are the Costs of Being a Reserve Currency in a Global Liquidity Trap?
By the same token, our analysis implies that if a currency appreciates, possibly because it is perceived as a ‘reserve currency,’ then this economy would experience a disproportionate share of the global liquidity trap. That is, while outside a global liquidity trap a reserve currency status is mostly a blessing as it buys additional purchasing power, in a liquidity trap the reserve currency status exacerbates the domestic liquidity trap. Arguably, this mechanism captures a dimension of the exchange rate appreciation struggles of Switzerland during the recent European turmoil, of Japan before the implementation of ‘Abenomics’, and of the US currently. We dub this result, the ‘paradox of the reserve currency’.
How do Differential Inflation Targets and the Degree of Price Rigidity Influence the Distribution of the Impact of a Global Liquidity Trap?
As usual, inflation is important because higher expected inflation reduces the impact of the (nominal) ZLB constraint. Beyond this, we show that unlike the all-or-none result of the benchmark model with fully rigid prices, it is possible for some regions of the world to escape the liquidity trap if their inflation targets are sufficiently high. We also show that wage flexibility plays out differently across countries and at the global level. In a global liquidity trap, inflation rates are equated across countries, so as to equate real interest rates. It follows that countries with more downward price flexibility bear a smaller share of the global recession. At the global level, however, more downward price flexibility tends to increase global real interest rates, pushing the global economy further into recession.
What is the Role of (Safe) Public Debt and Government Spending in This Environment?
Our model is non-Ricardian, which gives a role to debt policy. Both issuing additional debt or a balance budget increase in government spending can potentially address the net shortage of assets and stimulate the economy in all countries, alleviating a global liquidity trap. They are associated with large Keynesian multipliers, which exceed one in the case of government spending. They also worsen the current account and net foreign asset position of the country undertaking the policy stimulus.
Final Remarks
World interest rates and global imbalances go hand in hand: countries with large safe asset shortages run current account surpluses and drag the world interest rate down. Once at the ZLB, the global asset market is in disequilibrium: there is a global safe asset shortage that cannot be resolved by lower world interest rates. It is instead dissipated by a world recession, which is propagated by global imbalances: surplus countries push world output down, exerting a negative externality on the world economy. Economic policy enters a regime of increased interdependence across the world, with either negative or positive spillovers depending on the policy instrument. Exchange rate policy becomes a zero-sum game of currency wars where each country seeks to depreciate its exchange rate to stimulate its economy, at the expense of other countries. In contrast, safe public debt issuances and increases in government spending are positive-sum and benefit other countries beyond the frontier of the issuer.
Unfortunately, this state of affairs is not likely to go away any time soon. In particular, there are no good substitutes in sight for the role played by US Treasuries in satisfying global safe asset demand. With a mature US growing at rates lower than those of safe asset demander countries (as highlighted by The Economist in October 2015), its debt and currency are likely to remain under upward pressure, dragging down (safe) interest rates and inflation, and therefore keeping the world economy (too) near the dangerous ZLB zone.
While we are at the early stages of experimentation with negative policy rates, it is highly unlikely that the space in this direction is large enough to make a first-order difference to the ZLB logic. Moreover, there is nothing magic about ‘zero’ interest rates per se, as the mechanism carries more broadly to scenarios where interest rates have limited space to be the main equilibrating variable.
See original post for references


‘As Warren Mosler said via e-mail, another way to look at this paper is that it proves “Nothing more than insufficient deficit spending.”’
Can you please provide more context for this quote? Or, more to the point, can you paraphrase more of his comment so the meaning of that snippet is clearer?
Basically, Mosler doesn’t believe in the “natural”, or “equilibrium”, or “magical” interest rate, the one at which everything falls into place. Right now, we need more spending, and the best way to get more spending is to lower taxes and/or raise public outlays; tweaking the IR, and whining because we are at the ZLB, is pretty much useless.
…fiscal policy does and has done what monetary policy can’t and hasn’t…and banksters won’t.
We econ bloggers have been saying for a while that countries were exporting their demand deficiencies, so this is not so groundbreaking for us, even though it’s being spun as a shock to “real” economists (and perhaps it is). Still, it’s nice to see a model with comparatively plausible assumptions, at least for an econ model, verify our intuitions and observations.
One frightening conclusion (although also one that’s kind of common knowledge here) is “They [interventions to fix the problem] also worsen the current account and net foreign asset position of the country undertaking the policy stimulus.” So without global consensus to end the worldwide liquidity trap – virtually impossible with all the conservative governments about – any one country that tries to better things ends up assumes a lot of costs to benefit people in other nations. It’s a classic tragedy of the commons, and those often come out poorly on this scale.
Weren’t Bernanke and Summers disagreeing in that exchange? The way it’s summarized in that paper reads like there’s not much to disagree about. A liquidity trap is a pretty likely financial manifestation of secular stagnation.
I don’t like the term “liquidity trap”, it’s an admission the plumbing is bad, “I’m sorry Madame, there’s a blockage somewhere and we don’t know how to fix it”.
If liquidity traps are being exported they are exporting their own ignorance.
The vegetable patch is not being watered and Warren is pointing at the hose pipe. These idiots are peering behind the ornamental fountain looking down the cistern.
Wow. This is what Ed Bucks, the mathematical economist from MIT, was doing before he flipped out completely. I still remember the day I saw him walk into the New Hampshire woods with his binoculars, red faced and agitated. He said to me “They’ve created a labyrinth of insanity. They’ve banished free will, completely, from the most human of affairs. How can they not see this? How could I not have seen this? I spent years working on these useless equations. Useless. Useless. I need to see reality. That’s what I need to do.” I couldn’t stop him. He was like a religious zealot who’d finally seen the face of God. Last week I heard he was still up in the tree. Evidently he had the sense to take food, water and a winterized sleeping bag with him. If he’s not down by Thanksgiving, we’re going to dress up in Bigfoot costumes and pelt him with rocks (we won’t hit him, just scare him down, hopefully).
Have you tried trying to coax him down with the promise of a signed copy of Das Kapital? You could just use a bundle of National Enquirers, by the time he’s realised you’re fibbing he’ll be out of the tree. Actually, he may well not be able to tell the difference.
Incidentally, I couldn’t find a reference to a “Mr. Bucks” on the MIT website. He really should consider getting a new agent to raise his profile; eduction is a brutal business these days, so I hear.
You could ask Ben Carson if he’d go and try and talk Ed down out of the tree. I don’t know what Ben would say. Maybe, ” Hello, my name is Ben Carson and I’m running for President. Did you know that the Egyptian pyramids were really grain silos and King Tut was a grain farmer? Also, that Darwin had horns and a pointy tail? May I have your vote? I have a country that needs running.”
That might coax Ed out of the tree. Or maybe not. Hard to tell.
He’s just embarrassed because he didn’t realise the intention was to banish free will all along. He’ll come down when he realises he’s not the smartest monkey up a tree who got duped.
But the underlying question isn’t addressed here: why is their an excess demand for financial assets, (i.e. an excess demand for savings over investment)?
Investment opportunities are harder to find in the face of demographic decline and flat prices.
Internet shopping makes for a hypercompetitive environment, while ZIRP means no fat passive returns.
Remember all the ‘dumb money’ made in real estate during the inflationary era? You didn’t have to be a brain surgeon.
Now even the brain surgeons are stumped.
Because of weak demand. Wages are too low, and getting lower. Economists constantly talk in terms of aggregate demand and this hides the fact. It is necessary to disaggregate demand and examine it dynamically.
Demand is not weak nor are wages low. They are rising and the government is lagging with wages like they always do.
Interest rates are low because central banks are waiting to long because they fail to follow demographics.
The Boomers are gone people. Accept that.
What on earth does “the Boomers are gone” have to do with any of this?
Thae stolt all teh waaelf…
Yay be it … though neither is demand high nor wages high, I confound you with my touché of trickery wordiness.
I’d like to read this in simple language. It sounds like a big fat rationalization of financial assets. They might as well write up an analysis of the benefits of the gold standard.
I don’t think it can even be expressed in simple language, for if the attempt were made, it would lose all meaning. It, in fact, is a self-consistent and complete language fit for a purpose and untranslatable. The purpose is the relentless effort to apply Newtonian gravitational metaphors to movements of imagination.
I believe Mr. “Greenspeak”, aka Alan Greenspan, is widely credited with setting the “tone” by developing the language of creative-ambiguity, delivered with a halo of “sageness”.
Although there’s plenty to choose from, I would nominate this quote from Mr. “fedspeak” as numero uno head-scratcher:-“ I’m sure you think you understand what you thought I said but I’m not sure you realize that what you heard is not what I meant”.
Not unsimilarly, “You keep using that word. I do not think it means what you think it means.”
Yes, he built-up quite an impressive arsenal during his tenure…the ancient sophists would be awestruck and mesmerized.
To be sure, if the words do not make the meaning clear the words have no meaning other than to bamboozle.
That’s why I appreciate the graphs. I learned a lot from them, regardless of the authors’ thesis.
Another missing factor: aren’t the billions in Cayman’s etc of un-taxed revenue of “foreign” American companies also liquidity traps?
So is slave labor coupled with higher productivity. I think “demand” may be the missing link.
It ain’t over until it’s over. That’s when you get the black hole.
I’m quite sure the only black hole they are seeing is from bending over to look up their own ……..
“Exchange rate policy becomes a zero-sum game of currency wars where each country seeks to depreciate its exchange rate to stimulate its economy, at the expense of other countries. In contrast, safe public debt issuances and increases in government spending are positive-sum and benefit other countries beyond the frontier of the issuer.”
I’ve only glanced at this and don’t have time to try to understand it right now, so I may be way off base. But I want to ask the question. Public spending can’t happen without political support. So long as other countries can free-ride, it is difficult to assemble political will. The solution would be to restrict the benefits of spending within the country. This suggests to me that equal treatment measures and enforcement (e.g. ISDS in TPP) lead to tragedy. Am I out to lunch?
No you are facing front of class. TPP is designed to ensure no public money is spent for the good of the people.
This whole devaluation strategy to increase exports seems like a failed neoliberal type strategy.
China is a good example of workers producing goods that they export but can’t afford themselves.
A stronger currency would give them more wage power to buy domestically.
Gets back to efforts to get quantitative easing type money into the right hands. If the liquidity went to the right people, the poor, it wouldn’t be trapped.
Bingo, all the liquidity is trapped in the cisterns of the wealthy landowners while the poor are denied access to the water pump.
No no, this kind of trap:
If you don’t install a liquidity trap your house is permeated by foul odors. Oh, wait… Government is not like a household….
That may well be where Krugman’s mind is trapped, but I’m not sure you should be posting pictures of your household plumbing in public Lambert.