By Arthur Berman, a petroleum geologist with 36 years of oil and gas industry experience. He is an expert on U.S. shale plays and is currently consulting for several E&P companies and capital groups in the energy sector. Berman is an associate editor of the American Association of Petroleum Geologists Bulletin, and was a managing editor and frequent contributor to theoildrum.com. He is a Director of the Association for the Study of Peak Oil, and has served on the boards of directors of The Houston Geological Society and The Society of Independent Professional Earth Scientists. Originally published at OilPrice
U.S. crude oil storage is filling up with unaccounted-for oil. There is a lot more oil in storage than the amount that can be accounted for by domestic production and imports.
That’s a big problem since oil prices move up or down based on the U.S. crude oil storage report. Oil stocks in inventory represent surplus supply. Increasing or decreasing inventory levels generally push prices lower or higher because they indicate trends toward longer term over-supply or under-supply.
Why Inventories Matter
Inventory levels have reached record highs since the oil-price collapse in 2014. This surplus supply is a major factor keeping oil prices low.
Current inventories are 45 million barrels higher than 2015 levels, which were more than 100 million barrels higher than the average from 2010 through 2014 (Figure 1). Until the present surplus is reduced by almost 150 million barrels down to the 2010-2014 average, there is little technical possibility of a sustained oil-price recovery.
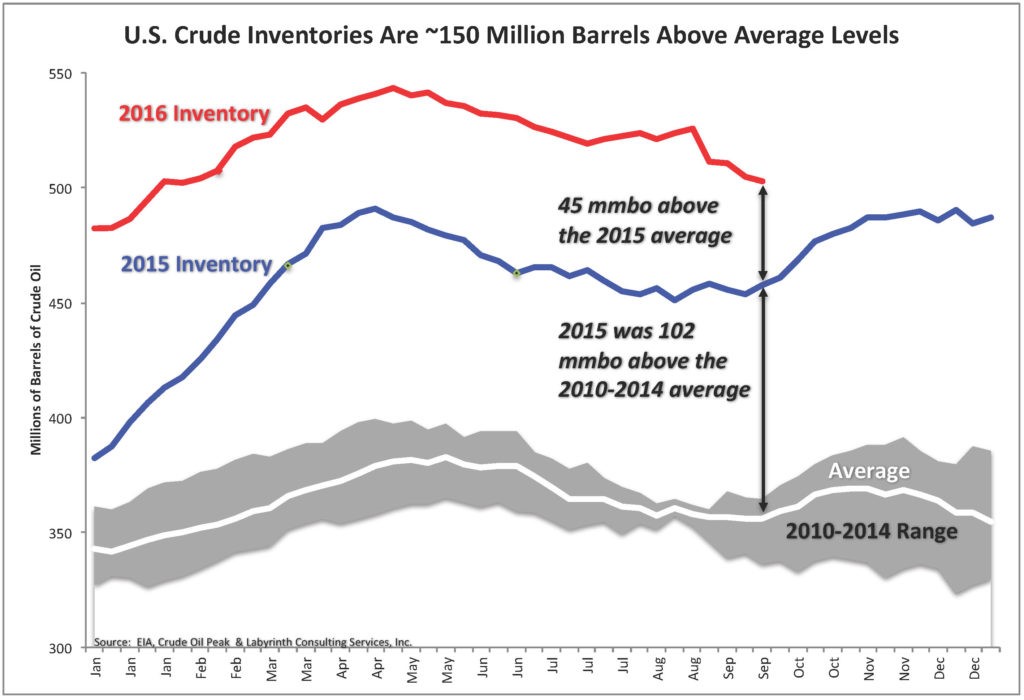
Figure 1. U.S. Crude Inventories Are ~150 Million Barrels Above Average Levels. Source: EIA, Crude Oil Peak and Labyrinth Consulting Services, Inc.
U.S. inventories are critical because stock levels are published every week by the U.S. EIA (Energy Information Administration). The IEA (International Energy Agency) publishes OECD inventories, but that data is only published monthly and it measures liquids but not crude oil. It also largely parallels U.S. stock levels that account for almost half of its volume. Inventories for the rest of the world are more speculative.
Understanding U.S. Stock Levels
Understanding U.S. stock levels should be straight-forward. Every Wednesday, EIA publishes the Weekly Petroleum Status Report which includes a table similar to Figure 2.
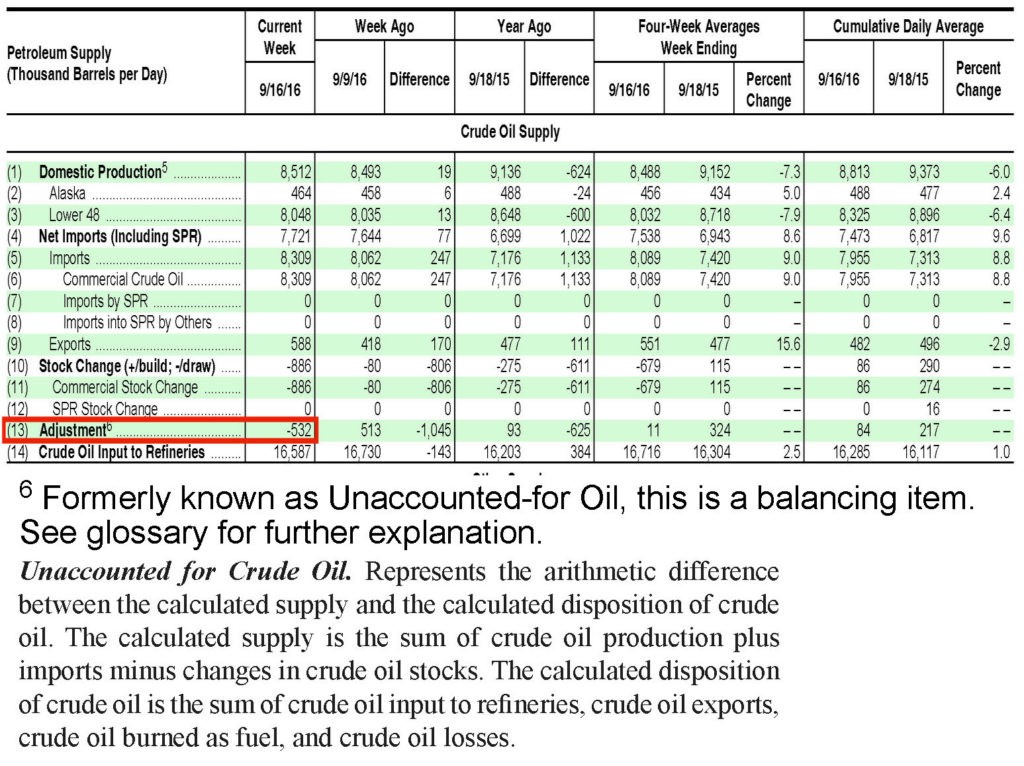
Figure 2. EIA publishes adjustments and defines them as “Unaccounted-for Oil.” Source: EIA U.S. Petroleum Status Weekly (Week Ending September 16, 2016), Crude Oil Peak and Labyrinth Consulting Services, Inc.
The calculation to determine the expected weekly stock change is fairly simple:
Stock Change = Domestic Production + Net Imports – Crude Oil Input to Refineries
Domestic production and net imports account for crude oil supply, and refinery inputs account for the volume of oil that is refined into petroleum products. If there is a surplus, it should show up as an addition to inventory and a deficit, as a withdrawal from inventory.
But that’s not how it works because EIA uses an adjustment in order to balance the books (Table 1).
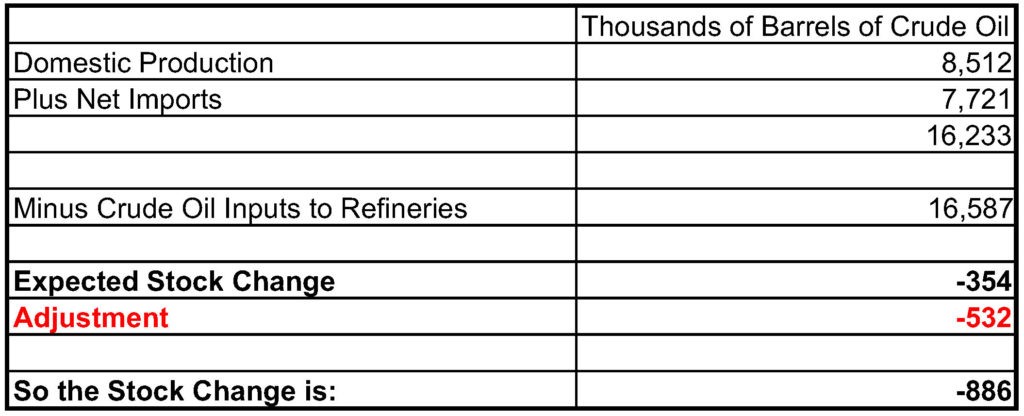
Table 1. Calculation of Crude Oil Stock Change. Source: EIA Petroleum Status Weekly, Crude Oil Peak and Labyrinth Consulting Services, Inc.
The logic is that estimated stock levels in tank farms and underground storage are relatively dependable and that any imbalance must be from less reliable production, net import or refinery intake data.
There is nothing wrong with adjustment factors if they are small in comparison to what is to be balanced. In the Table 1 example from September 2016, however, the adjustment is 60 percent of the stock change–a bit too much.
A one-off perhaps? No, it’s a permanent problem that has gotten worse during the last several years.
Figure 3 shows that crude oil supply and refinery intake of oil vary considerably on a weekly basis. The balance is cumulatively negative over time beginning with a zero balance in January 1983. That suggests that crude oil stocks should be falling over time but instead, they have been rising.
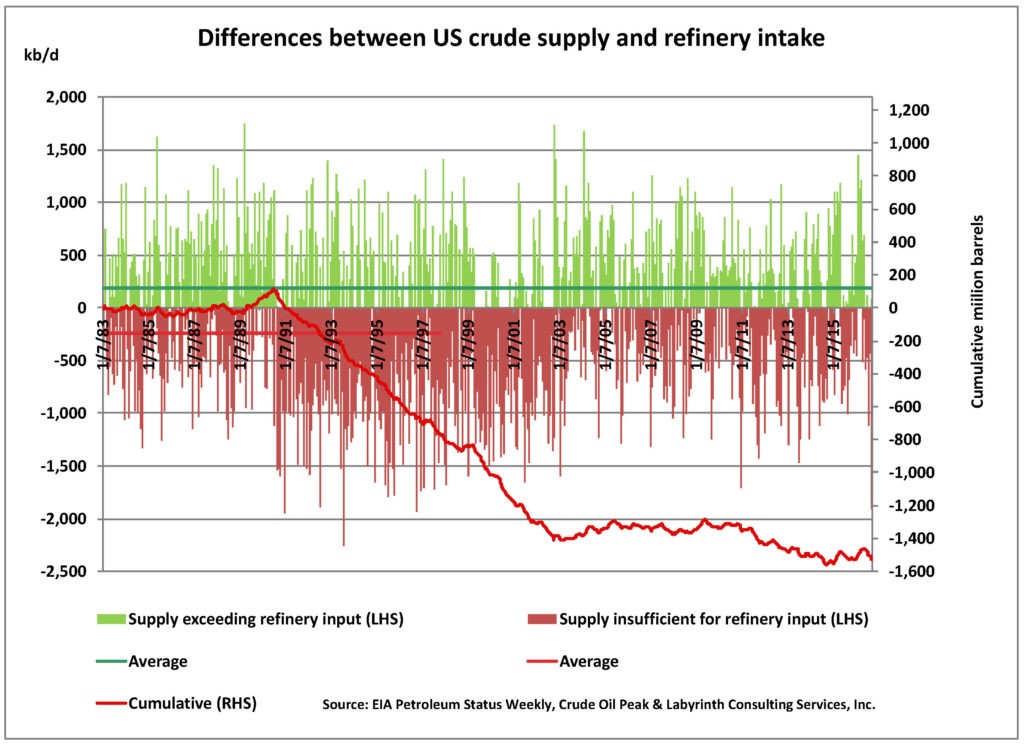
Figure 3. Difference between U.S. crude oil supply and refinery intake. Source: EIA Petroleum Status Weekly.
The vertical bars show the weekly crude supply from production and net imports either exceeding the refinery input requirements (positive, green) or not reaching these requirements (negative, red). The solid red line is the cumulative.
Between 1991 and 2002, the deficit increased to a whopping 1.3 billion barrels.
Looking at only recent history, an additional gap of nearly 200 million barrels developed as refinery intake exceeded crude oil supply for most of 2010 through 2014 (Figure 4).
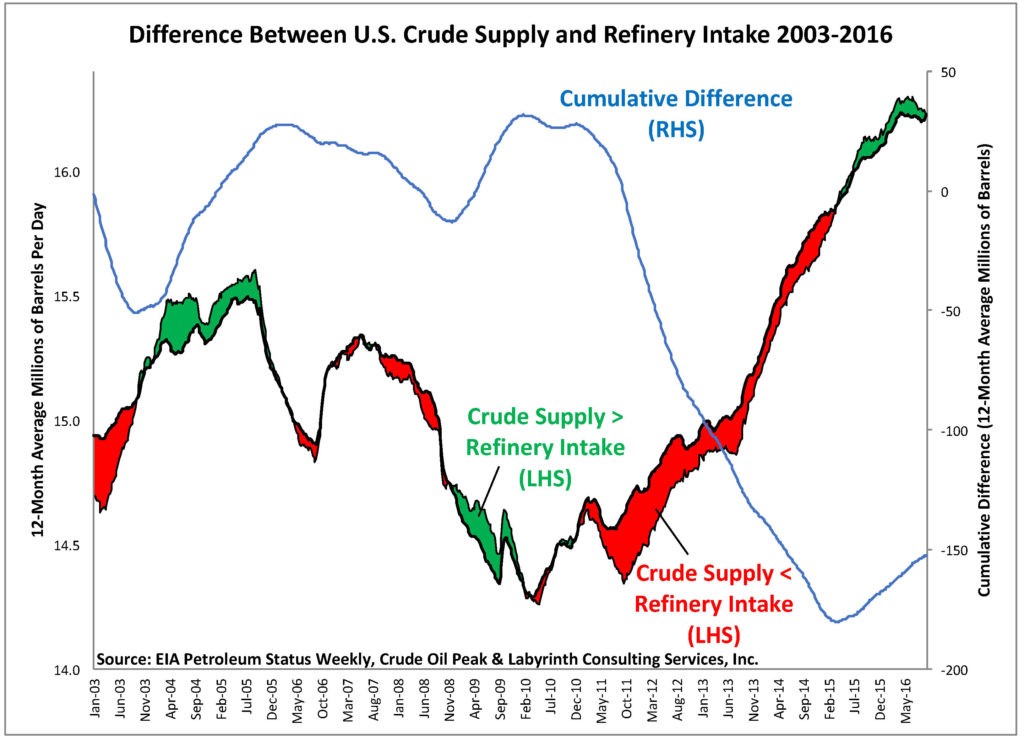
Figure 4. Difference between U.S. crude oil supply and refinery intake 2002-2016 (12-month moving average values). Source: EIA Petroleum Status Weekly, Crude Oil Peak and Labyrinth Consulting Services, Inc.
Adjustments were introduced in late 2001 so let’s look at the period starting January 2002 (Figure 5).
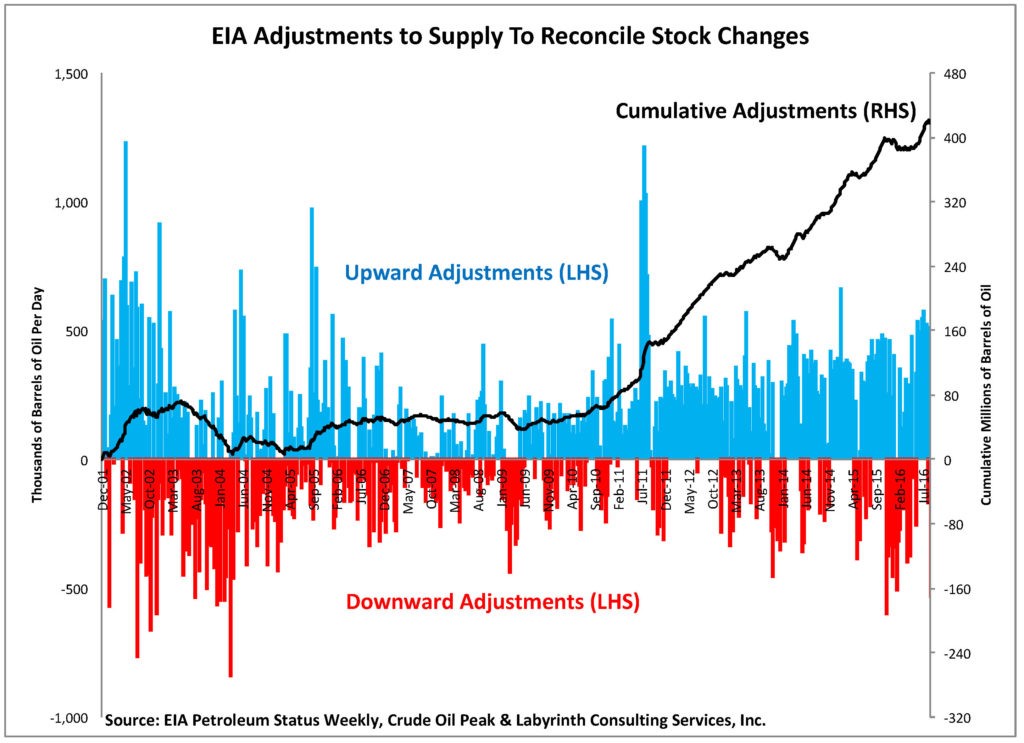
Figure 5. EIA adjustments to supply to reconcile stock changes. Source: EIA Petroleum Status Weekly, Crude Oil Peak and Labyrinth Consulting Services, Inc.
There are both upward (blue) and downward (red) adjustments. Upward adjustments resulted in a 420-million-barrel stock increase over the period January 2002 through September 2016.
All Together Now
Expected or implied stock changes calculated from weekly crude oil balance indicate falling inventories from May 2009 through the present. Yet, EIA makes adjustments to that balance in order to match observed inventory levels. Rising inventories result after those adjustments are added to the physical balance or implied stock changes (Figure 6).
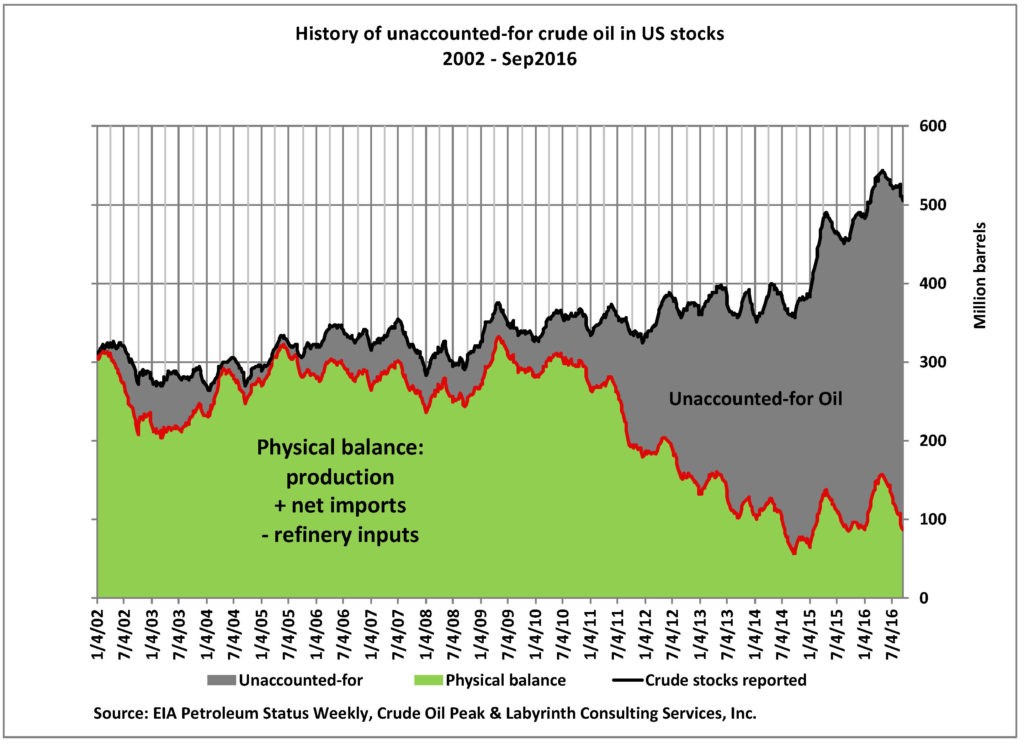
Figure 6. Unaccounted-for oil in U.S. storage: the result of adjustments to the supply balance. Source: EIA Petroleum Status Weekly, Crude Oil Peak and Labyrinth Consulting Services, Inc.
The green area represents the physical balance (crude production plus net crude imports minus crude refinery intake). The gray area shows the unaccounted-for (adjusted) stocks.
The adjustment for unaccounted-for oil averaged about 15 percent from 2002 through 2010. In 2016, almost 80 percent of reported stocks are from unaccounted-for oil.
When You Have Eliminated The Impossible
There is no obvious solution for the mystery of unaccounted-for oil in U.S. inventories. Possible explanations, however, include:
1. Crude field production is underestimated
2. Net crude oil imports are underestimated
3. Refinery inputs are over-reported
4. Crude oil stocks are over-reported
or any combination of those possibilities.
Production, imports and refinery inputs are taxable transactions. It is likely that reporting errors are largely self-correcting over time because of the financial incentive for government to collect its due.
State regulatory agencies are the source of production data. Their principal objective is to assess production taxes. It is unlikely that states would consistently under-estimate production and forego substantial tax revenue.
Also, producers must state crude oil production in their SEC (U.S. Securities and Exchange Commission) filings and pay federal income tax on revenues from oil sales. It seems improbable that the SEC and U.S. Treasury would consistently accept under-reported production and associated lower tax payments.
Crude oil imports are subject to both tariffs and excise taxes so it seems unlikely that the U.S. government would consistently fail to identify under-payment of those revenues.
Similarly, taxes are involved when refiners buy crude oil and sell refined products. It seems improbable that they would over-state those transactions and consistently over-pay associated taxes.
The principal components of supply balance—production, imports and refinery intake—are shown in Figure 7. In a general way, increased production and decreased imports tend to cancel each other out. Refinery intake has increased since about 2010.
Those trends determine the physical balance or implied stocks. The inescapable conclusion is that implied stocks (in light blue) are substantially less than reported stocks (in gray).
Adjustments for unaccounted-for oil are unreasonable and out of proportion to the underlying factors that determine crude oil stock levels.
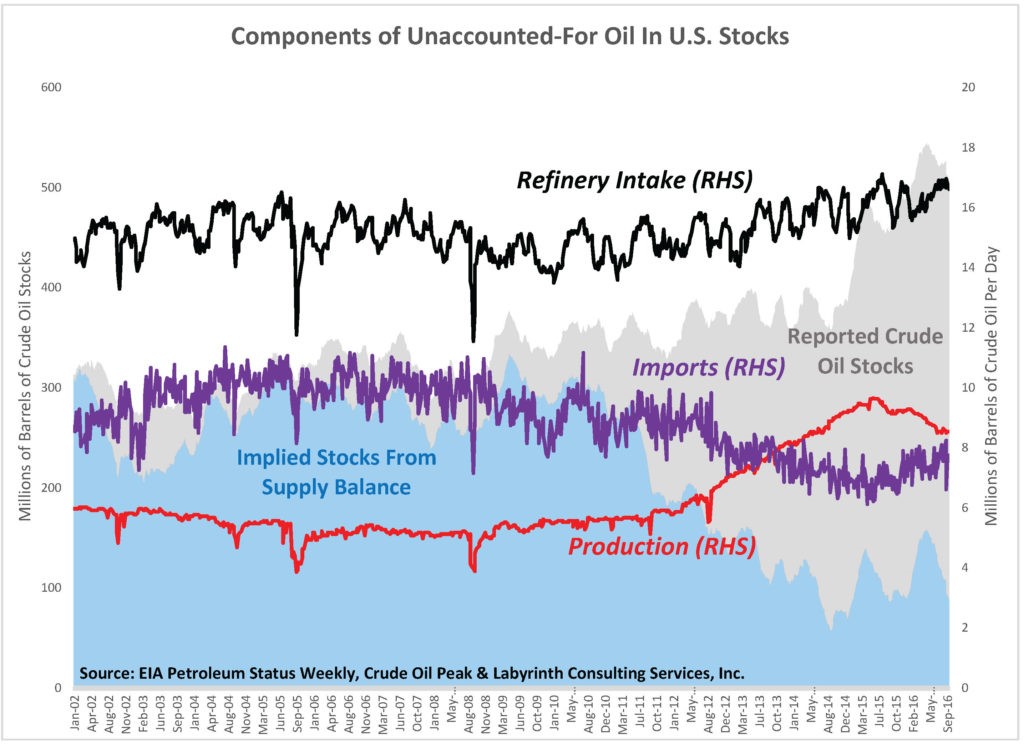
Figure 7. Components of unaccounted-for oil in U.S. storage. Source: EIA Petroleum Status Weekly, Crude Oil Peak and Labyrinth Consulting Services, Inc.
It would be speculation to blame anyone for this apparent statistical disaster. Nevertheless, there is a problem that has major implications for oil price and the reliability of reported data.
In several of his Sherlock Holmes mystery stories, Arthur Conan-Doyle wrote, “When you have eliminated the impossible, whatever remains, however improbable, must be the truth.”
We have not eliminated any impossible explanations. We have, however, eliminated the three most improbable explanations for unaccounted-for oil.
The truth—however improbable—is that inventories are probably much lower than what is reported.


How big is the strategic petroleum reserve?
About nine days of world production, not counting any Super Sekrit Strategeric Reserves earmarked for Important people and purposes.
The same barrel sold to more than one buyer? As long as demand for refined product doesn’t exceed supply of crude whose to known. Imaginary barrels would be a lot cheaper to store as well, whilst charging full fees of course. Didn’t the giant squid pull off a similar trick with it’s metal warehouses?
I find this very hard to get my head around. How or why would inventories be so low after a period of such cheap oil? Just 6 months or so ago there were stories of oil tankers sitting around the Gulf of Mexico, essentially acting as overflow stores. I can’t see any reason for it, unless there is some strange distortion caused by some tax dodge.
Or inflated stock prices. Oil in the ground is like gold in Fort Knox. It doesn’t circulate, but it creates a belief in the value of the owners of receipts to the gold (or oil). Shell Oil stock took a big drop a few years ago when it was shown they were manipulating their reserve numbers. You can flood the market with withdrawals of gold, drive down the price and still have a hole somewhere in the vault where half the reserves were taken out. As long as the market doesn’t find out, then It does not matter until the other half is drawn clear.
On the other hand, the author has made some assumptions about the data sets, which I’m not yet comfortable about — I’ll wait to see if others pick out even more. After all, this author may have shorts on some oil companies.
Its Monday morning and my brain isn’t quite working yet so maybe I’m misreading the article entirely, but I can’t quite square the first line:
with the last line:
Ambiguous: author appears to use ‘inventories’ both for actual stock and for what’s in the books. So the books are being cooked with the adjustment. I think.
PlutoniumKun, your brain is probably working alright, it was just thrown off by the unfortunate choice of the word “swindle” in the headline, which i doubt was Berman’s doing…there is no swindle here, just inaccurate reporting of data…does anyone think the government has the assets in place to produce exact data on production from every US oil well, oil refined by every refinery, amount of oil stored in every tank across the entire country for every Friday by the Wednesday of the next week? more likely, the EIA is only an estimate in a range, like Census estimates of housing data (which also move markets) which is collected by canvassing Census agents who drive their districts and record observations on their laptops..monthly new home data typically comes up with a 90% confidence figure +/- 15%, oil stats are certainly better but not exact….i would attribute the deterioration of the data to budget cuts sooner than any purposeful fudge on anyone’s part…
read Berman carefully, as he is exposing a fudge factor that the EIA uses weekly that i’ve been covering for a year…there’s no deceit about it, it’s there every week on line 13 of the oil balance sheet….since the other numbers which have their accuracy determined by that fudge factor are those that move the markets, that weekly adjustment should likewise be covered by the media, so everyone knows how inaccurate those weekly numbers are…i write about those numbers weekly, but since i discovered that “adjustment” when i went looking for the reason the numbers didn’t add up, i’ve been including it in the first paragraph of my coverage of the EIA’s weekly oil stats every week: http://focusonfracking.blogspot.com/
Thanks rjs, your blog is excellent, a great source of raw data for those of us without the time and energy to plough through the primary sources.
if anyone is still following this thread, it turns out that it isn’t the oil inventory figures that are in error, it’s the oil production figures that have been understated…i show that here by comparing the weekly production estimates to the confirmed monthly figures, which shows that the EIA’s weekly output figures were 233,000 barrels per day short of what was actually being produced in August, the last month we have confirmed data for…
http://focusonfracking.blogspot.com/2016/11/finding-missing-us-oil-production-while.html
Maybe. The conspiracy theorist in me says that the US government is over-reporting stocks in order to keep the oil price low. This has the effect of making the Obama economy look better and weaken Russia.
Not to mention Latin America and the rest of the world that is threatening the Absolute Empire.
Snowden showed that conspiracy theorists were the most realistic of people. So what you say is certainly correct. The days of giving any president the be fit of the doubt are long over.
*benefit
On the balance of probabilities we should start our investigation into the most obvious cause – US imports are understated.
Libya, Syria and Iraq production appears to have dropped off the charts although the wells are pumping and lorries and pipes and ships are carrying away the production to somewhere.
The uncertainty is which port is loading – does it have the US Skulls and Crossbones flag flying or the European one?
Well, the saudis are about ready to cry ‘uncle’, and russia and venezuela are still hanging on. Iran seems okay, too. The plan may be back-firing, or at least may be unsuccessful.
Berman shakes his stick at it, but crude just won’t listen — up 1.5% today:
http://bigcharts.marketwatch.com/quickchart/quickchart.asp?symb=clz6&insttype=&freq=&show=
The reporting prior to ~2002 is in error, as the cumulative gap of 1.3 billion barrels cannot be drawn from a strategic reserve that holds only .7 billion barrels (wikipedia).
The later figures seems going off-track by 2009-2010. Now let’s imagine I am a fracker, always needing fresh money. Perhaps it is in my interest to declare bigger production and bigger stocks than actually produced. I’ll have to pay a few dollars in taxes, but can get at millions of dollars in fresh capital.
The author states Production+Import+Adjustments-Refinery Inputs = Reported Stock, and goes to ‘demonstrate’ why Production, Import and Refinery inputs should be correct, but I didn’t see an argument on Reported Stock.
Inventories include tank farms, storage in ships, etc in addition to the SPR.
Unlike Berman, I put more stock in inventory reports than in the flow data which creates the seeming gap.
Every tank in a tank farm has a level gauge. So does the SPR. This is simple, primary data. Whereas flow data comes from a number of disparate sources that may contain biases, errors and omissions.
If that’s the case, then inventories are what they are. The so-called gap simply measures the cumulative error in a weekly report series.
Similar cumulative errors exist in national accounting data for capital flows. Nobody suggests that the stock of financial balances is wrong. Rather, some of flows are not reported.
Yes levels in tanks are measured. Are they reported correctly?
There are interesting tax consequences to under-reporting the amount stored, and the jurisdiction of the Banks to which receipts are paid.
The conclusion rests on the assumption that reporting for taxes is correct? I’d be shocked if such fine upstanding companies as the ones in the oil-industry did anything dodgy with their filings…
Maybe a book will be written patterned after “The Great Salad Oil Swindle” (of 1962), by Norman C. Miller. Gots to Luv the leverage in them futures contracts… What’s old is new?
Assuming Berman’s analysis is generally accurate, who has motivation, organizational leverage and control over information flows to pull it off. Seems to me the Oil & Gas sector is too fragmented for it to be major industry players.
Oh my. In that vegetable oil swindle, the tanks of oil were mostly filled with water. The oil floated on the top.
https://en.wikipedia.org/wiki/Tino_De_Angelis
The SPR has always had an unknown aspect for me. How much oil pumped back into the ground may be leaking out? Is it possible that supplies have been dwindling due to that, and if so, how would we know? How good is the proverbial dip stick for measuring SPR volumes?
Oil is lighter than water. Supposedly the water pressure keeps the oil in to reservoir. If there were leaks the some of the oil would probably be all over the ground.
One lesson from this is that we can’t be certain about how much available petroleum there is. For those who drive a car, when it’s time to buy a replacement, be sure to get one with good fuel mileage, even if gasoline is currently cheap. Fuel prices might not stay cheap.
I don’t buy the international conspiracy theory targeting Russia. Maybe there is a domestic political conspiracy theory, though. Could state and federal governments be foregoing tax revenue to prop up the domestic oil industry? It acts as an invisible subsidy to an industry that is in serious pain and keeps voters employed.
It seems self-evident that all official figures and formulae that can be gamed for fraud would be gamed in order to keep failing too-big-to-(appear-to-)fail institutions from appearing to be failing. Our dear esteemed CalPERS, and plenty of celebrated “jawbs” for which local governments forgo local taxes, serve as precedent in that regard.
” It seems improbable that the SEC and U.S. Treasury would consistently accept under-reported production and associated lower tax payments’ – and similarly for state tax accounting.
Is it really that unlikely? Or has he put his finger on a truly gigantic bezzle?
It also “seems unlikely” that those storing oil would overreport their stocks, thus driving down the value of their stock in trade. It seems more likely that producers, etc., would bribe the tax authorities to overlook one huge amount of oil.
(Haven’t read the other comments yet, so this may be duplicative.)
The Treasury and the SEC have not ability whatsoever to monitor the production of any sort of physical commodity. That’s not what they do. The only place I’ve seen where there are decent numbers on production of all sorts is Japan, where what was then MITI required extensive reporting by all manufacturers.
We wrote years ago, when oil priced to $147, how bad the data on oil is (including this article in Slate). Just imagine what it would take to get a comprehensive look.
That’s what makes oil, aluminum, etc, so attractive to fraudsters like Marc Rich/Pincus Green, Richard Blum (Sen. Feinstein’s husband), –oh, and every director of Exxon-Mobil, Shell, Atlantic Richfield, etc.
Does waste/recycled oil come into play? There should a recycled tank at almost every auto parts place and at every oil changing store. There are a lot sub-reports which make up this one reports at the IEA page does recycled oil have a line item.