By New Deal Democrat. Originally published at Angry Bear
In the last several years, I have written a number of posts documenting the stagnation in average and median wages, followed by their improvement due to the steep decline in gas prices, for example here and here. Since bottoming a year ago, gas prices have turned positive YoY, most recently up about 25%. Q4 2016 data on wages has been released, giving us a chance to take an updated look.
We have a variety of economic data series to track both average and median wages:
- The most commonly known measure is that of average hourly pay for nonsupervisory workers, which is part of the monthly jobs report.
- The Bureau of Labor Statistics, which conducts the household employment survey, also reports “usual weekly earnings” for full time workers each quarter.
- The BLS also measures the Employment Cost Index quarterly.
- The BLS also measures “business sector compensation per hour” quarterly.
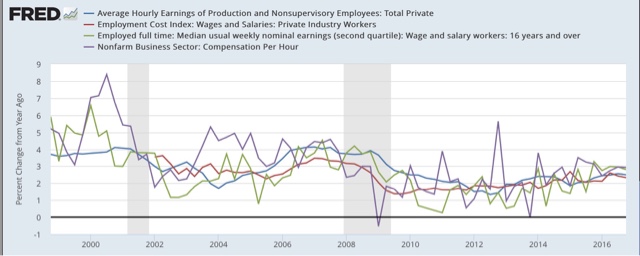
Let’s start with nominal wages. The first graph below shows the YoY% growth in each of the four measures:

While each is noisy, the overall trends are clear. First, in this cycle as in the last, wage growth declined coming out of recessions, then rose as the expansion continued. Second, secularly there has been an undeniable slowdown in wage growth, which was 4-6% in the late 1990s peak, 3-4% at the 2000s peak, and so far in this expansion is no better than 2-3%. I believe this is in part due to how weak the employment situation was for so long into this expansion, but also secularly due to shifts in bargaining power, as employers learn over time that employees can be retained with lower and lower annual increases in compensation.
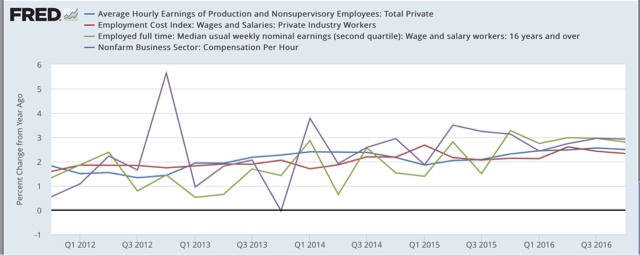
Next, let’s zoom in on the last 5 years:

Again, through the noise you can see that YoY wage growth was about 0.5%-2% in 2011-12, but has slowly improved to 2-3% in 2016. That’s the good news. The bad news is, none of these measures of wage growth show any accretion of the gains during the entire last year: despite a tighter job market, nominal wage growth *remained* at the +2% to +3% YoY level throughout the year.
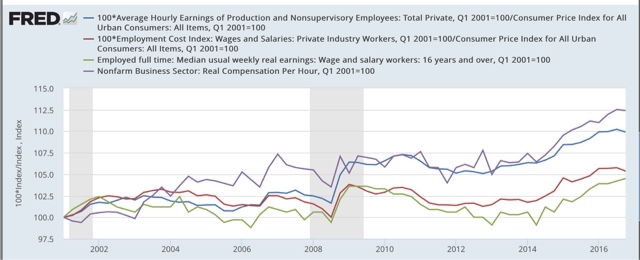
Now let’s turn to the real, inflation-adjusted measures. Our first graph starts out normed to 100 for each measure in 2001.

With the exception of real compensation per hour (purple), none of the measures made any real improvement during the 2000s expansion. After a spike during the Great Recession due entirely to the collapse of gas prices at that time, real wage growth declined into the 2013 time frame, and rose significantly since — again having much to do with the late 2014- early 2016 decline in gas prices. Note the divergence between the mean measure of the average hourly earnings (blue) and median measure in the employment cost index (red), showing that gains have been skewed towards the upper end of the income distribution.
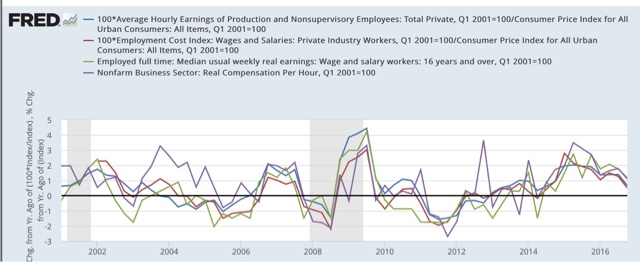
Finally, let’s look at the YoY% real growth in the four measures:

Here the picture is not good at all. After growing 2-3% in real terms during 2014-15, in 2016 real wage growth decelerated to only 0.5%-1.5% across the spectrum of measures. Since gas prices were still declining in Q1 2016, it is likely that real wage growth YoY as of the end of this quarter will have almost completely stalled.
In summary, our broad measures of wages showed continued nominal and real growth in 2016, but nominally failed to show any further acceleration despite a tightening job market, and in real terms decelerated sharply and are on the verge of stalling altogether. If my read on the labor market is correct — i.e., we are in late cycle and YoY job gains will continue to decelerate — and if inflation driven by gas prices and housing continues, the prospects for further meaningful wage growth for the broad mass of American workers during this cycle are dim.


Could someone elaborate on the mechanism whereby lower gas prices are feeding through to faster nonimal wage growth? I can understand the impact on real wages via the follow through to inflation, but if anything, weaker inflation would be a reason to push back on any requests for higher nominal wages.
I can’t explain the thinking, in fact I’d argue it’s dead wrong. If anything, lower fuel costs should roll out to lower heating, transportation, and food costs. These may lower pressure on the pocket book, but do not equate to higher wages, as far as I know. In fact, if you are tied to oil and gas production, wages are down on average 20% from the ridiculous highs during the boom from 2008- 2014.
I have yet to notice dropping food costs.
The biggest hidden inflation impact is local real property taxes— whether you own or rent, they are skyrocketing in the cool and groovy blue mountain blue river Rockies. Net effect, one step forward, two steps back, one nostril up , and the water is choppy.
I think if that was implied in the piece, it is a mistake. Clearly the emphasis in on the point that real wages have not been rising except for periods when gas prices decline.
Can’t speak for New Deal democrat, but I would venture that the logic could be twofold.
1. The strength of the economy depends a great deal on the cost of energy inputs. Lower gas prices reduce costs for businesses and consumers and therefore spur economic activity.
2. Lower gas prices reduce inflation. Wage levels could continue to rise at the same rate. The result is higher wages in real terms.
Thank you, Yves.
It’s the same in the UK, made worse by Sterling’s decline. Needless to say, the issue gets little coverage.
When the UK “goes global” from 2019, one wonders what the punters will say as further pressure is exerted on living standards. Still, the Tories are on course to win the next elections, due in 2020. A week is a long time in politics, but the Tories should be able to hang on. The blairites / neo-liberals and neo-cons will disrupt Labour’s attempt to rebuild and recover.
Here is an interesting article on black Americans wealth (or lack thereof) looking at many of the institutional barriers associated with growing their wealth and income. In a numbers game using continuous improvement types of strategies, this would be the low-hanging fruit to get improvements in society-wide income and wealth. On the political front, it is probably sitting up high on a mountain, inaccessible. But these types of improvements have been the key to improving Americans’ lot over the past couple of centuries.
https://www.bloomberg.com/view/articles/2017-02-13/what-s-keeping-black-americans-poor
I’d love to see a prediction of what wage growth WOULD have been, if health insurance costs hadn’t continued to skyrocket. Where’s your raise? It went to Aetna’s shareholders.
Costs per capita are growing even in nations with universal healthcare, although not the same extent.
Remember this?
https://ourworldindata.org/wp-content/uploads/2016/04/ftotHealthExp_pC_USD_long.png
Keep in mind that life expectancies decreased slightly in 2015. I’d be prepared to bet that medical costs and insurance premiums did not.
I’d also be prepared to bet that in 2016, we’re going to find vast increases in insurance premiums and would not be surprised if life expectancy was stagnant or declined.
I think the charts above don’t include fringe benefits. Only wages and salaries and, for “real compensation” only, social security contributions, which should be a direct multiple.
Could this be explained by Gen Xers, being the generation that primarily makes up the 35-50 age range where wage growth is most significant, make up only ~33% of the total labor force (which I am assuming is low compared to the time when Baby Boomers were centered on the 35-50 age range). Therefore the wage-growth-driving age range (35-50) has less of an effect on total wage growth than it has in the past? That would lead me to believe as millennials (the largest generation in the US labor force as of 2015) move into the 35-50 age range, total average wage growth will be more heavily influenced by the 35-50 wage growth rate again and accelerate above current levels and possibly above historic averages?
http://www.pewresearch.org/fact-tank/2015/05/11/millennials-surpass-gen-xers-as-the-largest-generation-in-u-s-labor-force/
I’m an X-er, and I can only wish for wage growth. I’ve had flat to decreasing wages since 2009, and flat only due to a switch from full time to contract. I don’t think my situation is exceptional.
I have no hope for the future anymore. As a middling contract worker who’s at the doorstep of 50, I’m approaching (if not arrived at) unemployable as younger workers are cheaper and my skill set is viewed as obsolete. The best I can do is survive.
Could this indicate that this cycle is coming to an end?
We’re actually overdue for a recession. The last one started over 9 years ago. It remains to be seen how long the “Donald Trump effect” can keep the economy going before we inevitably have another recession.
It’s reassuring to know that despite 30+ years of inadequate watering, I mean wage growth, economists and policy makers are at the ready to stomp on any green shoots that might nonetheless appear.
What will Trump’s supporters in rural and small town America do if their wages are still stagnant in 2018? Will they vote for challengers in the primaries? Will they vote against incumbents in the general election?
NDD at NC? Wow!
I thought I’d seen everything. But, as I type this, there’s a flock of pigs flying by my office window tonight, too. Damn!
And these real income results, dismal as they are, would look even worse if we didn’t use today’s deliberately understated inflation figures.