Yves here. The study summarize below makes an intriguing, if discouraging, finding. People are shopping less often and making bigger purchases. The evidence supports the idea that bulk buys, as in the need or desire to get better prices, is one important factor. Another probable one is time stress.
By Olivier Coibion, Associate Professor, UT Austin; Professor Department of Economics, UC – Berkeley; Dmitri Koustas, PhD candidate in Economics, UC – Berkeley. Originally published at VoxEU
Rising income inequality has received extensive attention from economists in recent years. However, changes in consumption inequality – which is potentially more relevant for welfare – have been largely neglected. Using US data, this column explores measurement issues and trends in household consumption. A key trend identified is that US households have been shifting towards stockpiling behaviour – shopping less frequently but purchasing larger quantities per trip.
Income inequality has been rising sharply since the 1980s, raising concerns among economists, policymakers, and the general public. However, whether consumption inequality has gone up in similar fashion, which is arguably more relevant for welfare, remains the subject of heated debate. Understanding what has happened to consumption inequality can also be informative about the forces underlying the rise in income inequality.
Different Trends in Consumption Inequality
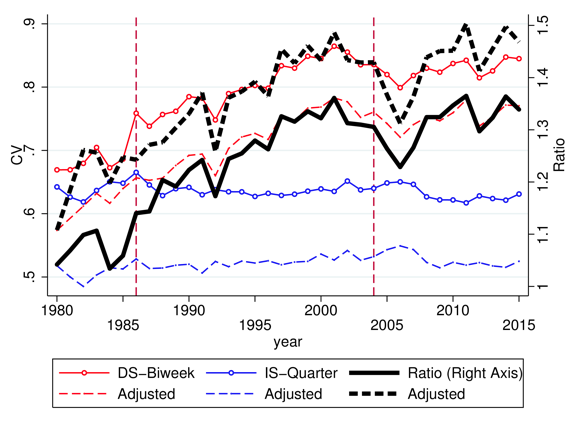
Unfortunately, the available data on consumption do not provide an easy answer. For the US there are two primary data sources available to measure consumption inequality – the Diary Survey and the Interview Survey – both from the Survey of Consumer Expenditures (CEX). While the latter points toward little change in expenditure inequality over time (as documented in Krueger and Perri 2005), the former instead suggests that expenditure inequality has risen more closely in line with income inequality (e.g. Battistin 2003). Figure 1 below illustrates how the ratio of consumption inequality across the two surveys has been progressively rising over time.
Figure 1 Spending inequality in CEX Diary Survey and CEX Interview Survey

Notes: The figure plots the coefficient of variation (CV, left axis) of expenditures on non-durable goods and services across households in the Diary survey (DS-biweekly) and Interview survey (IS-quarterly) over time. The ratio of the two DS/IS) is plotted using the bold black line and measured on the right axis. Solid lines are raw measures while dashed lines are residual measures that control for household characteristics. Vertical lines indicate major structural breaks in diary survey design.
How the Frequency of Shopping Could Explain the Differences in Trends
Although there are many potential sources for this difference across surveys, in a recent paper we argue that the primary source is the differing frequency over which expenditures are measured; bi-weekly in the Diary Survey and monthly (or quarterly for some categories) in the Interview Survey (Coibion et al. 2017). To see how the frequency of measurement can matter, consider households’ purchases of paper towels. If households purchase them weekly and use them daily, it will not matter whether we observe their expenditures over a two-week period (as in the Diary survey) or over a quarter (as in the Interview survey), since each time horizon is long enough to capture purchases. But now suppose that households begin to stock up on paper towels once a month but continue to use the same amount daily. If we measure expenditures only over a two-week period, some households would report large expenditures on paper towels (because they stocked up for the month over that period) while others would report no expenditures (because they were still consuming from their stock of paper towels). So, when expenditures are measured over a short period, inequality would appear to have gone up even though the underlying consumption of paper towels by households remains the same. But measuring expenditures over a quarter would yield the same (and correct) conclusion as it did when households were not stocking up – inequality in consumption and expenditures is unchanged.
Changing Household Shopping Behaviour
Consistent with this intuition, we document that the frequency of shopping has indeed systematically declined over time. Using data from the CEX Diary Survey, we find that the fraction of days in which households engage in any shopping for non-durable goods has been falling over time, so that households concentrate their shopping into fewer days of the week (Figure 2). Using even more detailed information on household expenditures (albeit over a shorter period) from Nielsen HomeScan data, we again document a decline in the number of days in which households do their shopping. Hence, part of the greater increase in inequality as measured by the Diary Survey may indeed be coming from a changing frequency of shopping by households.
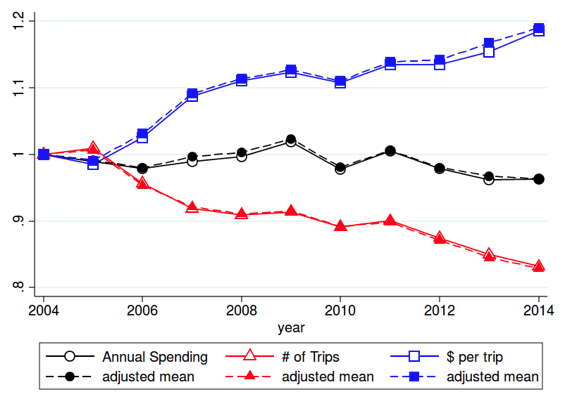
Figure 2 Consumer spending, number of shopping trips, and spending per trip

Notes: Solid lines with empty markers show the dynamics of the raw averages. Dashed lines with filled markers show the dynamics adjusted for changes in household characteristics. The black lines are the average log spending per year. The red lines are the average number of trips per year. The number of trips is the number of trips where the household scanned at least one UPC barcode. The blue lines are the average log spending per shopping trip in a given year. All series are normalised to one in year 2004. Spending is adjusted for inflation using the ‘Personal Consumption Expenditures (PCE): Chain-type Price Index’ (FRED Series: PCEPI).
Several additional pieces of evidence, based on micro data, support this conjecture. First, while average spending (adjusted for inflation) on goods in the Nielsen data has been approximately constant between 2004 and 2014, this masks underlying changes in shopping behaviour. The average number of shopping trips has been steadily falling over the entire sample, whereas the average spending per trip has been rising. Hence, we see households making fewer, but larger, shopping trips on average. Second, households have been purchasing larger quantities or volumes of goods over time, consistent with increased stocking up. Third, using the American Time Use Survey, we document a strong decline in the average amount of time spent shopping by US households, driven entirely by the extensive margin. Households do fewer trips per day and are less likely to go to any store on any given day, but spend the same amount of time at a store once they do go. These are precisely the expected patterns as households buy larger amounts of the same goods while at the store and therefore need to go to the store less often. Thus, the ability to stock up appears to be a critical component of these differences in trends.
The Rise of Club Stores
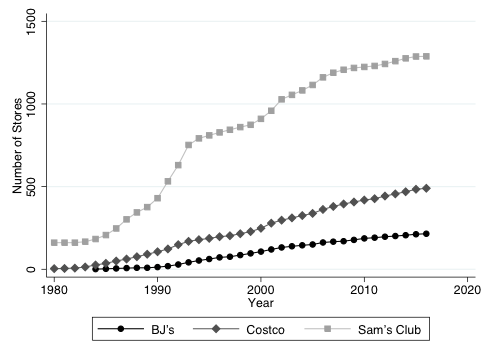
There are many mechanisms which could potentially explain why American households are increasingly purchasing larger quantities when shopping and therefore shopping less frequently. One such mechanism is the rise of club/warehouse stores (Costco, Sam’s Club, BJ’s, etc.) which, by design, sell larger quantities of goods to households at lower unit prices. As these stores have expanded throughout the country since the 1980s (see Figure 3), it has become easier for households to stock up in ways that were not feasible in the past, consistent with the decreased frequency of shopping that we observe. Furthermore, there is considerable geographic variation in the ease with which households can access one of these retailers, enabling us to quantify the contribution of this mechanism. The increased prevalence of club/warehouse stores since the early 1980s can account for approximately 40% of the rise in measured inequality in expenditures.
Figure 3 Rise of club stores
Panel A. Penetration of club stores

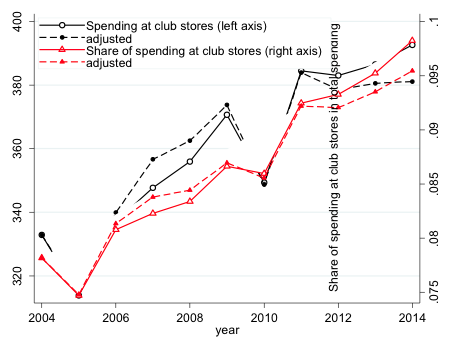
Panel B. Spending in club stores

Notes: Panel A plots the numbers of different club/warehouse stores over time. Panel B plots the average dollar amount of spending per household at club/warehouse stores and the average share of expenditures by households at these retailers for the goods covered in our sample (food-at-home, alcohol/tobacco, and small non-durables).
There are a number of other complementary explanations that could also help account for the changes in shopping behaviour. For example, anything raising the fixed cost of shopping trips, be it financial (e.g. rising gas prices, rising opportunity cost of time, increasingly moving away from city centres and stores) or in terms of the amount of time (e.g. through rising traffic), would contribute to the declining frequency of shopping. Another force that could lead to a falling frequency of shopping is the decline in the cost of storage, coming for example from increased ownership of refrigerators/freezers or the growing size of US houses. Expanded access to credit not only allows households to better smooth transitory economic shocks, thereby pushing down consumption inequality, but also has allowed households to better take advantage of bulk discounts like those available at club/warehouse stores. Interestingly, the expansion of credit may have acted to raise spending inequality through our mechanism when looking at high-frequency shopping patterns, while reducing this inequality in lower frequency data by allowing households to mitigate transitory income shocks. While we can rule out a number of these alternative explanations, future research will need better data to exclude or confirm other explanations.
Implications for Future Consumption Inequality Trends
The increased stocking up by households has had important implications for measured changes in consumption inequality over the last thirty years, particularly due to the rise of club/warehouse stores which facilitate and encourage larger sized purchases. As the market for club/warehouse stores becomes more saturated and as bulk goods become more prevalent even in non-club/warehouse stores, one may expect the patterns documented here to have less of an impact on measured spending inequality in the future. Furthermore, the growing prevalence of online retailing and home deliveries is reducing fixed costs of shopping associated with low unit prices and should therefore be pushing toward a higher frequency of shopping. As online retailing continues to grow in both size and scope, this implies we may observe a reversal of some of the patterns documented here. It therefore seems promising for future work to consider how these different forces will balance out so that we can better understand how to properly measure underlying trends in consumption inequality.
While we have focused only on issues surrounding the measurement of consumption inequality, there are also theoretical issues as to what types of consumption should be included for policy purposes. For example, one reasonable policy objective could be to minimize inequality in the consumption of necessities (the focus of our and many previous analyses) so that basic needs are satisfied for a wide spectrum of the population. However, it is also conceivable that inequality in conspicuous consumption may be particularly damaging for the cohesion of a society and therefore policymakers should target inequality for total consumption. We hope that future theoretical work will provide more guidance on what measure empirical research should concentrate on.
See original post for references

