Lambert here: I’m uncertain about the whole concept of “natural disaster,” at least as applied to Hurricane Harvey, because so much of the flooding seems to be caused by impermeable surfaces (like parking lots) that don’t soak up water like the prairie used to do, and so much of the human damage is caused by housing patterns, which are hardly randomized by income. (Poor people in Grenfell Tower were more vulnerable to fire, since the cheaper apartments where they tended to live were higher up in the building.) And that’s before we get to climate change. What’s “natural” about any of this?
By Silvia Merler, an Affiliate Fellow at Bruegel. Her main research interests include international macro and financial economics, central banking and EU institutions and policy making. Originally published at Bruegel.
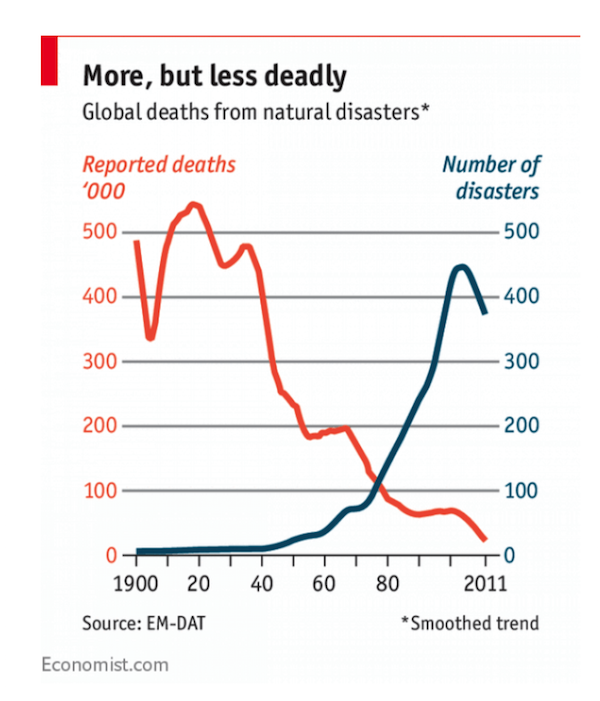
Are natural disasters becoming more expensive? Back in 2012, the IMF released a study finding that over the previous two years, 700 natural disasters were registered worldwide affecting more than 450 million people. Damages were estimated to have risen from $20 billion on average per year in the 1990s to about $100 billion per year during 2000–10. The Economist also has an interesting chart showing how the number of weather-related disasters is increasing but the death toll is decreasing (see below).
Figure 1

NASA’s Earth Observatory points out that natural disasters may be getting more expensive because more people are building more expensive infrastructure in areas that are prone to natural disasters, like coastal areas, fire-prone forests, steep mountain slopes, and riverbanks. In addition to increasing the cost of natural disasters, population growth and the landscape changes that go with it may make some disasters more severe. For example, when a swath of trees becomes a neighborhood or an office building, the ground changes from spongy, water-absorbing soil to impervious pavement.
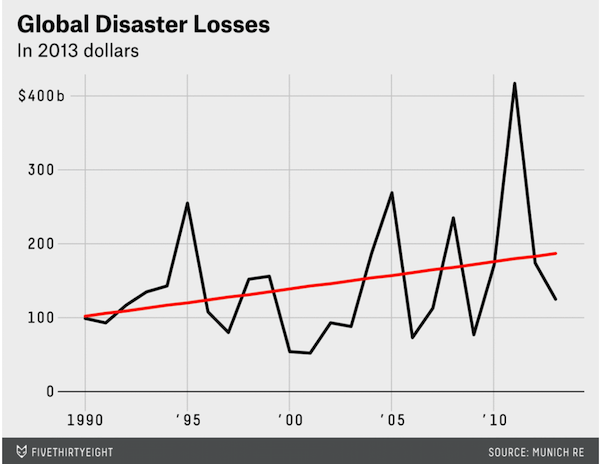
On FiveThirtyEight, University of Colorado’s Roger Pielke Jr. also agrees that that natural disasters cost more than ever (Figure 2) and he argues that this is linked to social changes, i.e. the numbers reflect more damage from catastrophes because the world is getting wealthier.
Figure 2

Source: FiveThirtyEight
Pielke points out that the data show an inverse relationship between lives lost and property damage: modern disasters seem to bring the greatest loss of life in places with the lowest property damage, and the most property damage where there’s the lowest loss of life. This is linked to the different ability to cope with disasters that countries have at different levels of income. As countries become richer, they are better able to deal with disasters — meaning more people are protected and fewer lose their lives, although the cost in terms of property losses increases.
Michael Grunwald on Politico argues that Harvey was a disaster foretold and Washington made it worse. He cites a 1998 report by the National Wildlife Federation which argued the U.S. government’s flood insurance program was making catastrophes worse by encouraging Americans to build and rebuild in flood-prone areas. Created in 1968, the National Flood Insurance Program was supposed to help prevent risky development by demanding that new construction within designated 100-year floodplains to meet higher flood-proofing standards and by requiring “substantially damaged” properties that received claims worth half their value to be relocated or elevated.
But Grunwald argues that most of the program’s 100-year flood maps are obsolete, relocation almost never happens, and the government has instead continued to cut multiple checks for repetitive losses, thus creating a bad incentive. An October 2016 Pew report also comes to similar conclusions. Flooding is the most costly and most common natural disaster in the United States and the Federal Emergency Management Agency’s National Flood Insurance Program (NFIP) provides federally backed coverage for homeowners and small businesses in more than 22,000 communities across the country. The report shows how repeatedly flooded properties cost billions, arguing that new policies are needed to break a cycle of loss and rebuilding.
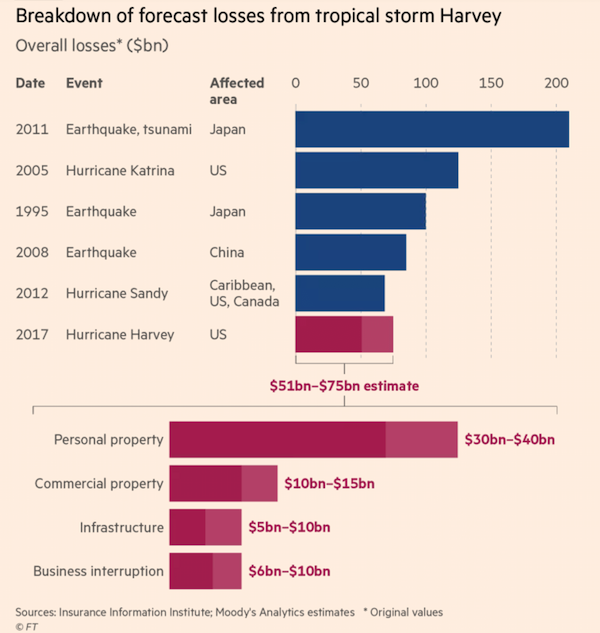
FT’s Alistair Gray reports preliminary estimates from Moody’s Analytics, according to which the storm will exact a toll of between about $50bn and $75bn (see Figure 3 below). The insurance industry is expected to avoid picking up much of the cost, as many householders lack cover for flooding (standard US home insurance policies exclude flood damage). As mentioned above, householders can get cover from the National Flood Insurance Program (NFIP), but only about one in six properties in the county in which Houston is located has the protection. Relatedly, FT’s Joe Rennison reports that storm Harvey has put up to $30bn of securitised commercial mortgages on the watch list of analysts and investors, as damage from the disaster has heightened the risk of defaults.
Figure 3

FT Alphaville has a good summary of early estimates for Harvey’s economic impact. J.P. Morgan’s insurance industry research team estimate that the physical damage will be in the $10-$20 billion range. The midpoint of the $10-$20 billion range is about 0.1%-pt of GDP. Total damage, and total rebuilding, should be greater than this amount, but they expect the overall impact on GDP in Q3 and Q4 to be quite small. Goldman Sachs argues that property losses will not be directly visible in most economic indicators, but major hurricanes in the past have been associated with a temporary slowdown in retail sales, construction spending, and industrial production, as well as a pickup in jobless claims. They estimate that Harvey has already shut down over 16.5% of US refining capacity, and that disruptions in the energy sector could directly reduce Q3 GDP growth by as much as 0.2pp. Deutsche Bank thinks that in the short-term, the most visible impacts will likely be to exports and industrial production, although some of the negative hit to growth will likely be offset by a boost to construction spending as rebuilding efforts get under way.
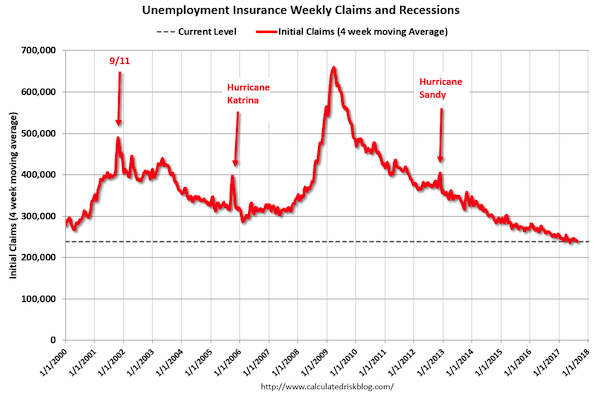
Bill McBride at Calculated Risk says that we can look back at Katrina (and Rita) for gauging the potential impact of Harvey on unemployment claims (Figure 3) . Hurricane Katrina made landfall on Aug 29, 2005. Unemployment claims moved higher over the next month, and stayed elevated for a couple of months. Claims also spiked following 9/11 and after Hurricane Sandy in late October 2012. The increase following Sandy was significant, but only lasted a few weeks (so the 4-week average didn’t increase as much as for Katrina). McBride’s expectation is that the 4-week average of claims will increase from the current level of 238,000 to over 300,000 over the next month.
Figure 4

Source: Calculated Risk

