By Wolf Richter, editor of Wolf Street. Originally published at Wolf Street
The moment the unemployment crisis stops getting worse and bottoms out would signal the beginning of a recovery of the job market. But instead, it’s still getting worse at a gut-wrenching pace.
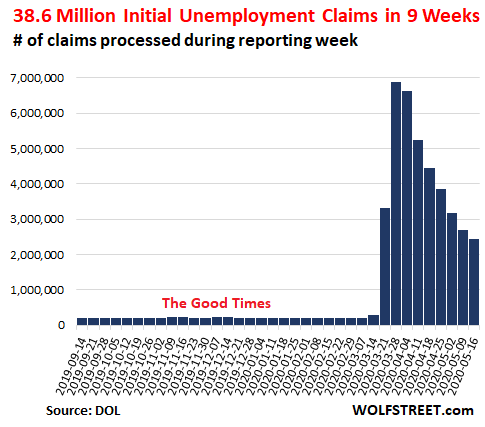
In the week ended May 16, state unemployment offices processed 2.438 million “initial claims” for unemployment insurance under state programs, bringing the total number of initial claims over the past nine reporting weeks since mid-March to a mind-bending 38.6 million (seasonally adjusted). The claims reported by the US Department of Labor this morning were over three times the magnitude of the prior weekly records during the unemployment crises in 1982 and 2009.

But It’s Even Worse: 4.4 Million Initial Claims with PUA.
These “initial claims” exclude the gig workers, self-employed, and contract workers who are now eligible to receive unemployment insurance under the special and temporary federal program in the stimulus package, called Pandemic Unemployment Assistance (PUA).
In the week ended May 16, an additional 2.23 million people (not seasonally adjusted) filed initial claims under the PUA program, up from the 850,000 that had filed the week ended May 9, and the 1 million that had filed in the week ended May 2. So in total, when regular initial claims (not seasonally adjusted) and PUA initial claims are combined for the week ended May 16, the total of initial claims (not seasonally adjusted) more than doubles to 4.4 million.
The Number of “Insured Unemployed” Spikes after Last Week’s Calm.
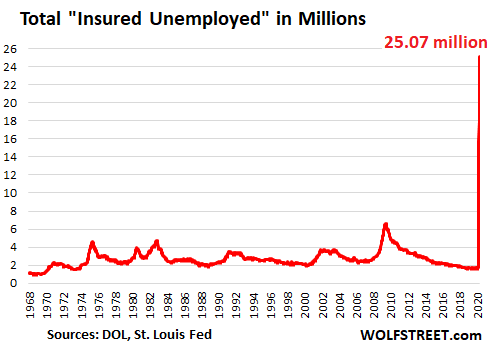
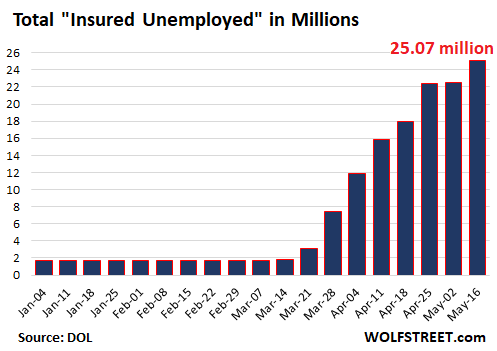
Laid-off workers who filed an “initial claim” for Unemployment Insurance (UI) and state programs and who are still looking for a job a week later are added to the “insured unemployment.” The number of these “continued claims” spiked by 2.525 million to 25.07 million, having weeks ago blown past the pre-Covid-19 record of 6.63 million in May of 2009:

Last week’s “insured unemployed” were heavily revised down today to 22.55 million (seasonally adjusted), just 171,000 above the prior week. And given the enormous magnitude, the revised totals for last week and the prior week look nearly flat in the chart below. However, today’s spike delayed any hopes that the bottom of the unemployment crisis was in

And It’s Even Worse… with the PUA: 27.3 Million.
These “insured unemployed” are those in the regular state UI programs and do not include the PUA claims. Including all types of claims, not seasonally adjusted, the total uninsured unemployed combined surged to 27.3 million.
The 28 States with the Most “Initial Claims.”
California is back in first place, after having dropped to third place last week behind Georgia and Florida. During the early phases of this crisis, California’s weekly initial claims exceeded 1 million. These are the regular initial claims and do not include PUA claims:
| Top 28 States, Initial Claims in the week ended May 16 | ||
| 1 | California | 246,115 |
| 2 | New York | 226,521 |
| 3 | Florida | 223,927 |
| 4 | Georgia | 176,548 |
| 5 | Washington | 145,228 |
| 6 | Texas | 134,381 |
| 7 | Illinois | 72,816 |
| 8 | Pennsylvania | 64,078 |
| 9 | Michigan | 54,460 |
| 10 | Kentucky | 47,036 |
| 11 | Ohio | 46,594 |
| 12 | North Carolina | 45,974 |
| 13 | Virginia | 45,788 |
| 14 | New Jersey | 41,323 |
| 15 | Massachusetts | 38,328 |
| 16 | Maryland | 34,304 |
| 17 | Arizona | 32,295 |
| 18 | Minnesota | 31,529 |
| 19 | Wisconsin | 31,314 |
| 20 | Indiana | 30,311 |
| 21 | South Carolina | 29,446 |
| 22 | Louisiana | 28,843 |
| 23 | Tennessee | 28,692 |
| 24 | Missouri | 26,029 |
| 25 | Connecticut | 26,013 |
| 26 | Alabama | 24,528 |
| 27 | Oklahoma | 23,880 |
| 28 | Oregon | 22,281 |
The “Insured Unemployment Rate” Per State
The national “insured unemployment rate” for the week ended May 9, also released today, jumped to 17.2%, from 15.5% in the prior week. For comparison, the record in the pre-Covid-19 era was 7.0% in May 1975.
The “insured unemployment rate” for each state, also released today, lags one week behind the national average. The table below shows the “insured unemployment rate” for each of the 50 states and Washington DC in the week ended May 2. There are 38 states plus Washington DC now with a double-digit “insured unemployment rate”; three states sport a rate above 20%:
| Insured Unemployment Rate by state, week ended May 2 | ||
| 1 | Nevada | 23.5% |
| 2 | Michigan | 22.6% |
| 3 | Washington | 22.1% |
| 4 | Rhode Island | 19.9% |
| 5 | New York | 19.6% |
| 6 | Connecticut | 19.3% |
| 7 | Mississippi | 18.8% |
| 8 | Vermont | 18.8% |
| 9 | Georgia | 18.5% |
| 10 | New Hampshire | 18.0% |
| 11 | Pennsylvania | 18.0% |
| 12 | Hawaii | 17.8% |
| 13 | New Jersey | 17.8% |
| 14 | Louisiana | 17.2% |
| 15 | Alaska | 16.5% |
| 16 | California | 16.4% |
| 17 | Oregon | 16.2% |
| 18 | Massachusetts | 16.1% |
| 19 | West Virginia | 16.1% |
| 20 | Minnesota | 15.0% |
| 21 | Maine | 14.5% |
| 22 | North Carolina | 14.1% |
| 23 | Ohio | 14.0% |
| 24 | Kentucky | 13.4% |
| 25 | Montana | 12.9% |
| 26 | South Carolina | 12.9% |
| 27 | Illinois | 12.8% |
| 28 | New Mexico | 12.6% |
| 29 | Iowa | 12.4% |
| 30 | Florida | 12.1% |
| 31 | Oklahoma | 11.4% |
| 32 | Delaware | 11.3% |
| 33 | District of Columbia | 11.3% |
| 34 | Alabama | 11.2% |
| 35 | Wisconsin | 11.0% |
| 36 | Tennessee | 10.5% |
| 37 | Virginia | 10.5% |
| 38 | Arkansas | 10.2% |
| 39 | Maryland | 10.0% |
| 40 | Colorado | 9.8% |
| 41 | Texas | 9.6% |
| 42 | Missouri | 9.5% |
| 43 | Indiana | 9.4% |
| 44 | Idaho | 8.9% |
| 45 | North Dakota | 8.7% |
| 46 | Kansas | 8.6% |
| 47 | Arizona | 7.9% |
| 48 | Nebraska | 7.1% |
| 49 | Wyoming | 6.6% |
| 50 | Utah | 6.2% |
| 51 | South Dakota | 5.6% |
“Insured Unemployment” are is Different from the Unemployed in the Jobs Report.
In today’s report, the number of “insured unemployed” under all programs, including PUA, of 27.3 million is the number of people with continuing Unemployment Insurance.
By contrast, the number of unemployed in the monthly jobs report is derived from household surveys and does not reflect UI. The household surveys that were collected in mid-April became part of the jobs report released on May 8. For that period in mid-April, the number of unemployed surged to 23.1 million. But not all of the people who are out of a job and are looking for work, as identified by the household survey, receive UI benefits. So the household surveys, when they catch up, should show an even higher number of unemployed than the 27.3 million of “insured unemployment” reported today.


A huge economic collapse is unfolding. The economy is contracting at an unprecedented rate. Millions of people are unemployed in a short period of time. Consumer confidence is broken. Uncertainty has replaced optimism. Friction (social distancing, waiting in lines, scarcity) is now a part of life and economic interactions.
Declaring the economy for business does not make it so. Those poor souls being recalled back to work (to end their unemployment) will be less busy than before and at increased risk for infection. Many will be laid off again when the level of business is less than before. In the pre-pandemic times, we could afford to wash each other’s laundry and call it economic and job growth.
The economy is shrinking and will be smaller for a long time. There’s less to go around. I don’t need nor can I afford to have someone else else wash my laundry for me anymore.
One of the interesting outcomes of this pandemic is millions or billions of people discovering the things they can do for themselves, or no longer need to do or have done by someone else. “Essential” personal care, home care, car care, and so on, turn out to be unnecessary or something one can do for oneself with some basic equipment and a YouTube video to show you how. Or perhaps they can easily be skipped altogether.
These changes are going to persist to a greater or lesser extent regardless of if or when the economy “reopens”.
When it comes to learning problem-solving skills, DIY is the best thing going.
All is chaos under heaven. The circumstances are excellent.
‘By contrast, the number of unemployed in the monthly jobs report is derived from household surveys and does not reflect UI. The household surveys that were collected in mid-April became part of the jobs report released on May 8. For that period in mid-April, the number of unemployed surged to 23.1 million. But not all of the people who are out of a job and are looking for work, as identified by the household survey, receive UI benefits. So the household surveys, when they catch up, should show an even higher number of unemployed than the 27.3 million of “insured unemployment” reported today…’
thanks for the reminder that there’s hell being paid for this lockdown every day, & that it’s not just some of the big guys that’re suffering…
these unfortunates are the other covid-19 victims…
This was baked into the cake, my friend, not a function of the lockdown. Just ask Sweden.
Are they counting filings like the CA Workshare, where employees with pay cuts can file for their missing percentage? Companies have to qualify, not individuals, but then individuals affected can apply. I only heard about this in California, so I don’t know of the situation elsewhere.
At any rate, the unemployment numbers are going to be higher than we will ever be officially told. I don’t think the government will ever officially admit the true unemployment numbers, especially from here on out.
And I mean NEVER EVER.
Well FRED isn’t hiding the U6:
Was at 22.8% as of May 6th
Now the press ain’t ever going to say that.
Shadowstats has it closer to 40%.
I think that the representatives and senators, the entire political class, are so disconnected especially as they still use the stock market as a measure of a healthy economy, that the sheer scale of the collapse is not being accepted as real; they still believe of this being a regular opportunity for disaster capitalism or pillaging and a cover for such actions as McConnell’s stuffing the judiciary with very conservative judges; greed, contempt, and arrogance has blinded them.
Let’s see what happens when the June 5th employment report comes out. The May report’s U-3 unemployment number is 14.7%, the U-6 is 22.8% and the real total unemployment number of the time they were compiled was likely 30% plus.
My gut says that all those numbers will go up by over 10 points. Hopefully, the shock will get them to be serious about the nation instead of just theirs, their patrons’ and cronies’ pocketbooks. If nothing else, the control of Congress will be dictated by what they do in the next few months. If they don’t get real after that, I think reality well get real with them.
The current unemployment numbers are horrendous. But I worry more about all the businesses and jobs that will be gone post Corona. Like the words in the Springsteen song: “Foreman says these jobs are going boys and they ain’t coming back …”
The news coverage of restaurants has prompted me to think about why there are so many of them in the first place. During my growing up years, I barely remember when the Slim family went out to eat. And I don’t recall it being a thing among my neighbors.
As for going to work, well, you brown bagged it and that was that.
Alongside all the news about restaurants being in trouble, there are reports of flour and yeast shortages. Which tells me that my fellow Americans are rediscovering the fine art of cooking at home.
The flour and yeast shortages tell me of inflexibility in our food supply chains, as much as they tell me of a resurgence of cooking at home. The shortages and price increases for ground meats tell what quality of cooking has surged.
Whether there were many restaurants in your life or not a large number of people once worked in food service, and small beauty parlors and barber shops, and scattered small businesses hanging on to small shops on Main Street. What jobs will replace the these jobs that are lost?
This should be worth another yuuge rally in the inequity markets, since the worse the news for the — ha, ha! Sooo dinosaurian, people actually trying to provide ‘goods’ and ‘services’, when all we need is more financial leverage — real economy (snicker), the better the odds of Uncle Feddie firehosing a few $trillions more at the Wall Street casino patrons.
I’m gonna start a “on which date will the holy DJIA exceed the number of employed people in the US” betting pool. Please post your dates!
27 Million uninsured workers not working?
The Pandemic Assistance Act will cover them, right?
Buuuut, the PUA benefits allegedly available to “gig workers, independant contractors, 1099 workers, freelancers”, etc aren’t really available unless they fit a very narrow means test.
It only counts IF
they lost work as a direct result of covid19
they lost work only March 29 2020 or later
they have not earned any W2 earnings at all in the past 18 months.
Almost be definition, freelancers accept multiple categories of compensation, even a days work receipted as “W2” because they are working gigs, and because employers decide how they will pay.
$25,000 in W9 work in 2019 and $250 in W2 work in 2018?
You get nothing.
Foolish gigers failed to foresee that ones day work in 2018 would disqualify them for disaster unemployment assistance in 2020. They made BAD CHOICES. Haw haw.
Call the UI office if you have any questions. Ha ha ha.
(YMMV, article says Cali’s PUA program will allow less than $1,300 in W2 earnings to still qualify for PUA “freelance” assistance. Can’t find a single reference to any other state policy, which appears to be default to $0)
Lazy bums.
https://www.latimes.com/california/story/2020-05-02/coronavirus-unemployment-gig-workers-benefits-pandemic
But we bailed out the billionaires and Wall St so everything is moving according to plan. If that small business was any good, it can now be bought for pennies on the dollar.
…Hmmm…*essential employees* … perhaps ….essential businesses?… essential Rich Persons???
…essential Government??? …The rest will be dealt with IF and WHEN…
oafstradamus