Yves here. Most of you have seen these charts, or variants of them, or written descriptions of similar findings. It is nevertheless useful to have them assembled, since they reveal, starkly, how much ordinary Americans have lost in recent decades.
By Laurie Macfarlane,economics editor at openDemocracy, and a research associate at the UCL Institute for Innovation and Public Purpose. He is the co-author of the critically acclaimed book ‘Rethinking the Economics of Land and Housing’. Originally published at openDemocracy
This week Americans will vote to decide who will be their next president. The result will not only change the course of history in the US – it will have major consequences around the world.
The 2020 race to the White House has been the most divisive for a generation. The campaign has been derailed by the COVID-19 pandemic, which so far has taken the lives of nearly a quarter of a million Americans – more than any other country in the world.
But the fractures running through US society long predate the pandemic. Here are six charts that reveal America’s deep social and economic divides.
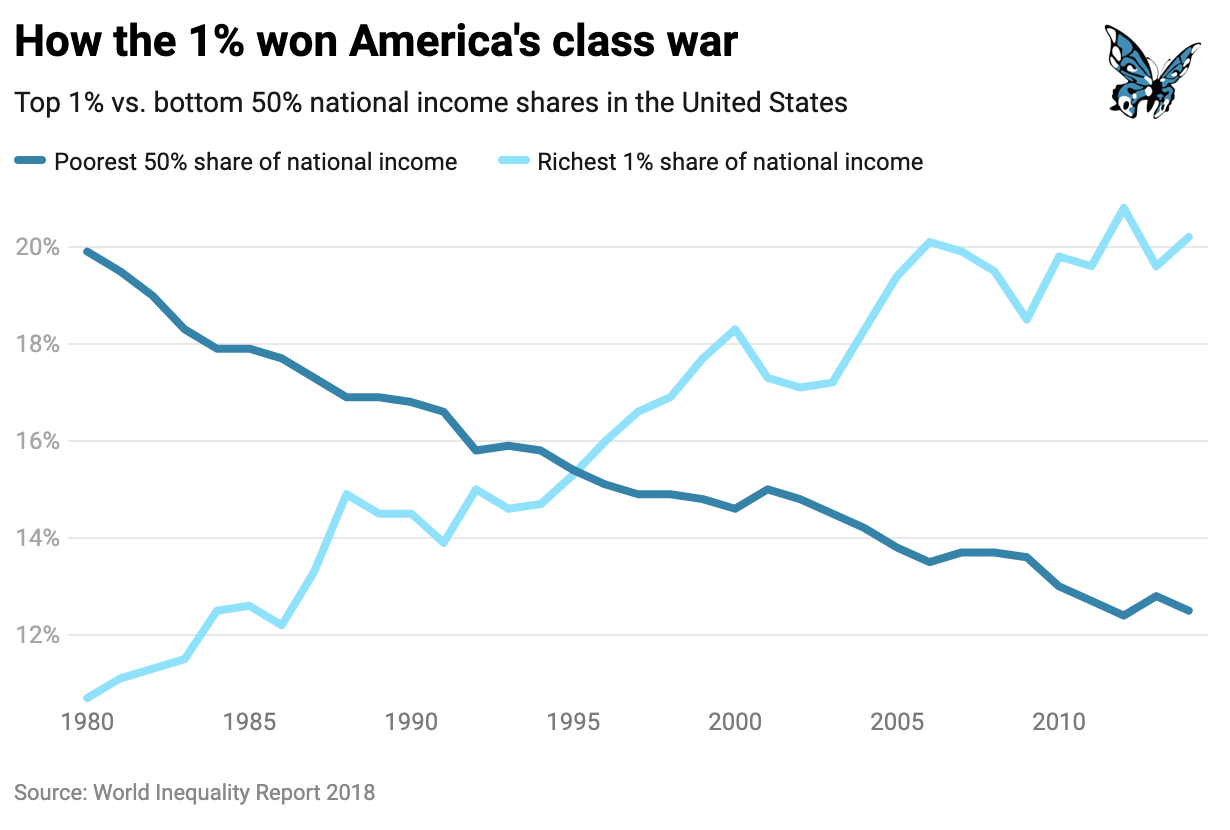
1. How the 1% won America’s class war
In 1980, the top 1% of earners took home 10% of US national income, and the bottom 50% of earners took home 20%. By 2016 however, these positions had reversed: the income share of the top 1% had increased to 20%, and the income share of the bottom 50% had decreased to 13%.
In other words: over the past four decades the top 1% have hoovered up an ever-growing share of national income at the expense of ordinary Americans. Although ‘class war’ rhetoric has never been popular in Washington, the reality is that lawmakers have been waging a class war for decades – on behalf of the rich against everyone else.
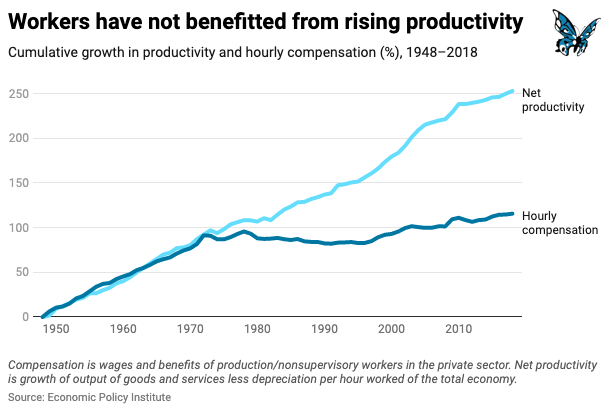
2. Workers have not benefited from rising productivity
Under capitalism, we are often told that ‘a rising tide lifts all boats’ – that as the economy grows, everybody should share in the rewards. And in the decades following the Second World War, this was broadly how the US economy worked.
Throughout the 1950s and 1960s, the hourly compensation of typical workers increased in line with productivity (how much workers produce per hour). In other words, as the economy became more productive and output expanded, American workers benefited through pay rises.
But in the 1970s, the link between productivity and pay began to break down. Between 1979 and 2018, productivity rose by 70%, while the hourly pay of typical workers essentially stagnated – increasing by only 12% after adjusting for inflation.
Although Americans are working more productively than ever, they are not reaping the equivalent financial rewards.
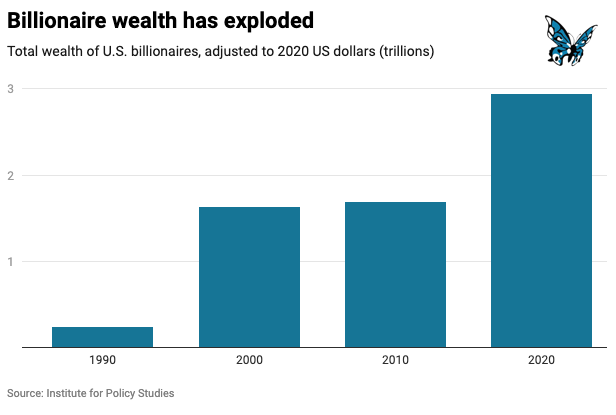
3. Billionaire wealth has exploded
If ordinary workers haven’t benefited from rising productivity, then who has? The answer can be found in soaring corporate profits, skyrocketing executive pay and the amassing of vast individual fortunes.
In 1990, there were 66 US billionaires who had a total wealth of $240 billion (in 2020 dollars). Today the US has 614 billionaires with a total wealth of nearly $3 trillion.
Between 1990 and 2020, American billionaires saw their net worth increase by over 1,130%, while median household net worth grew by only 5%.
Today three American billionaires – Jeff Bezos, Bill Gates, and Warren Buffett – own as much wealth as the bottom half of all US households combined.
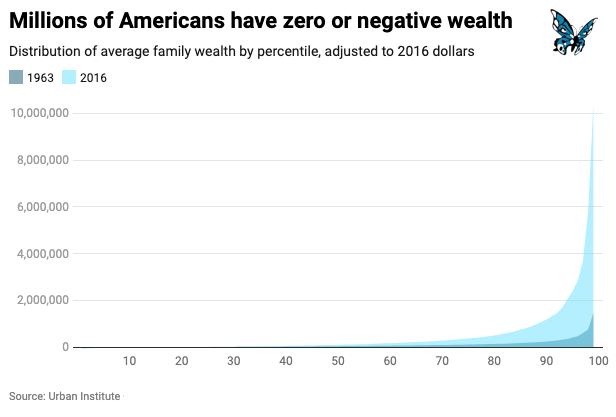
4. Millions of Americans have zero or negative wealth
While the total amount of wealth in the US has grown enormously over the past 50 years, not all Americans have become wealthier. Between 1963 and 2016 families at the bottom of the wealth distribution (those at the 10th percentile) went from having no wealth on average to being around $1,000 in debt. Meanwhile, families in the middle more than doubled their wealth, and those near the top (at the 90th percentile) saw their wealth increase fivefold.
The wealth of those at the 99th percentile – those wealthier than 99% of all families – grew sevenfold. These changes have caused wealth inequality to skyrocket.
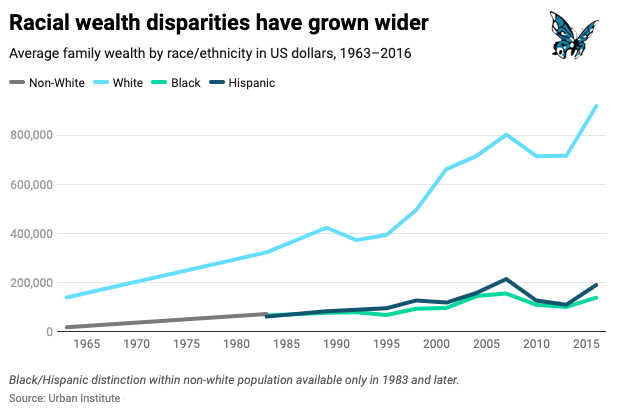
5. Racial wealth disparities have grown wider
The Black Lives Matter protests have shone a spotlight on the systemic racism that still plagues US society – from policing and criminal justice, to housing and healthcare.
But vast racial disparities also exist in the distribution of wealth. In 1963, the average wealth of White families was $121,000 higher than the average wealth of families of colour. By 2016, the average wealth of White families was over $700,000 higher than the average wealth of Black families and Hispanic families.
This means that in 2016 White family wealth was still seven times greater than Black family wealth and five times greater than Hispanic family wealth on average.
6. Lack of universal healthcare costs lives – and livelihoods
The US is unique among advanced economies in not providing universal healthcare coverage to its citizens. Despite spending moreon healthcare than any other country in the world, one study found that 45,000 Americans die every year as a result of not having any health insurance coverage. Since the COVID-19 pandemic began in March, 12 million people have lost their employee tied health insurance.
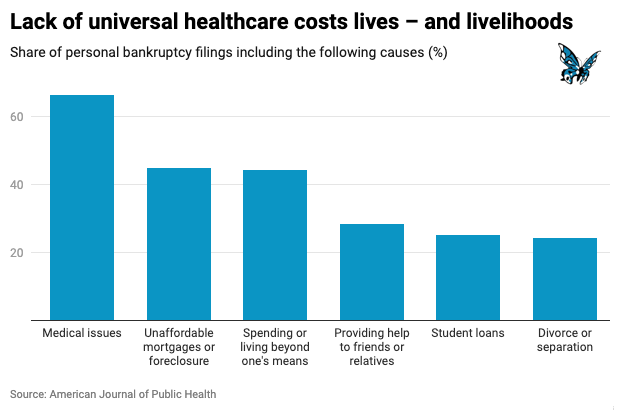
But the lack of universal healthcare not only costs lives – it also costs livelihoods. A recent study in the American Journal of Public Health found that 66.5% of all bankruptcies were tied to medical issues — either because of high costs for medical care or because of time taken out of work. An estimated 530,000 families turn to bankruptcy each year because of medical issues and bills, the research found.
This is significantly more than other causes such as unaffordable mortgages , spending or living beyond one’s means, providing help to friends or relatives, student loans, or divorce.


The worst thing about a Biden victory/Republican senate is knowing all those phony Citigroup Liberals got the perfect scenario for them, they get all the woke posturing with none of the tax increases, they are free to take on whichever regime change operation they desire and until that point they get to grandstand about how they defeated fascism.
On the plus side at least we can now stop pretending Trump had anything to do with the problems facing us.
You can stop worrying now. You will get what you voted for. (Think about that for the next four years of chaos.)
that is the most likely outcome regardless which dingdong wears the Emperor’s New Clothes.
Perhaps you missed the Biden message that “nothing will change?”
That’s some truth in advertising right there — in America it’s always Team Pepsi vs Team Coke: no matter which you choose, it’s neoliberal cola in the bottle …
Or as I like to think of it: Team Strychnine vs Team Arsenic.
I think you nailed it (especially with the second paragraph of yours). Well done.
Trump was just “bad for business”; under him, no one could pretend what so many in this country actually want or are willing to do to get it.
I wish you would speak of specifics so a logical debate could be shared. The income inequalities you may be angry about have not affected the middle class (falling from 70 to 67% by the math shared) and, if you get down it, it is just a handful of tech moguls that distort the wealthy numbers. A better question is “does the bottom 50% have a better quality of life?” and the answer to that is yes. It is yes because of the innovation Capitalism has made possible. And with that there are a few big winners. Go after them if you want, but I’d prefer you give them incentives to develop more new products or give their money away to causes they believe in.
You need to review the situation. The 2007-09 debacle was directly a Reagan republican party policies and actions. Eliminate regulation and stop enforcing what you do not like. S&L regulations under Reagan Trifecta, Republican rescinding anti bucket shop law in 2000; reusal to enforce SEC, CFTC & Subprime Mortgage lenders regulations under Bush43 trifecta, etc etc.
In 1980, the top 1% of earners took home 10% of US national income, and the bottom 50% of earners took home 20%. By 2016 however, these positions had reversed: the income share of the top 1% had increased to 20%, and the income share of the bottom 50% had decreased to 13%.
================================================
I say the same thing over and over, but I just can’t help myself. This is happening because of political decisions – it is not some geological, climatic, or evolution of physical processes. People aren’t becoming lazier or less intelligent. At one point, there were unions with their own economists and enough clout to get their viewpoint out for public debate. I ask you, other than NC and other blogs, where do you see any substantial reporting on the economic consequences of what is going on in Washington – pretty much now for 40 years it has been nothing but cheerleading for the “market.”
When I do my volunteer work about medicare, inevitably, I get someone who blames the high cost of their medicines on people on medi-cal. NEVER does it occur to any of these particular complainers that it is due to insurance companies, pharmaceutical companies, hospital companies.
(there are plenty of people who recognise that corporations are responsible for the pricing and have hijacked the political process for their own benefit – my point is that there is a concerted effort to deflect accountability from those who are ACTUALLY responsible for medical prices to those who have nothing to do with the price).
pre-pandemic, my wanderings and ad hoc symposia indicated that a large majority of ordinary folks realised that they were screwed by both government and the aristocracy that owns it, and that neither big party really cared about them.
i found this pretty much everywhere i went, from my feedstore in the wilderness, to a bustop in san antonio.
rattling off numbers like this, re: productivity/wages, only served to reinforce where they were already at.
from 2015 til a year ago, this was increasingly the case(all anecdata, i know).
pandemic, and the culturewarisation of it, has reinvigorated the partisanship that had begun to die.
like a new 9-11.
in fact, post-911 is what it feels like right now.
both sides are in lalaland, but it’s the Right that poses the most danger.
i became a lay anthropologist in order to understand the strange behaviour of people around me….and to survive high school,lol.
after 30+ years of close observation, humans still mystify me…and i’m glad i live in the middle of nowhere.
pre-pandemic, my wanderings and ad hoc symposia indicated that a large majority of ordinary folks realised that they were screwed by both government and the aristocracy that owns it, and that neither big party really cared about them.
_______________________________________________________________________________
That sums it up perfectly. And to such people/peons as ourselves, we having nothing but grief – that may explain the mystery of humans for you. I’m reminded of a Sitting Bull quote, that I’m going to change slightly, “We (the people) were promised many things, and all the promises were broken but one: that we will take all your money and they did.” If you haven’t read “the people,no” by Thomas Frank try it out, it’s even better as an audible as he narrates and he is excellent at that.
Those charts make me so angry. >:/
Time for a walk to cool off. :(
Actually the answer is simpler than you think. Use tariffs to penalize producers of “stuff” who fo not meet our employment, environmental, coean air, waste mgt, OSHA, etc standards & laws over their entire supply chain. Remove a layer of tariff when their supply chain meets our standards.
And limit deductibility of total executive compensation to 10x that of lowest paid employee or supcontract staff including customer service people in Mumbai, philippines, honduras, south africa or wherever.
Not hard – and work with WTO to make it world wide. Germany already looking at penalties for not meeting German standards over entire supply chain.
Think about it.
I find that second chart about productivity versus wages remarkable and have commented on it before. It may not look it but the gap between the two lines represents trillions of dollars now. And of course the split occurs back in the early 70s with the rise of neoliberalism. You could write a book about the consequences of this split happening. For a start, one was the increase in the use of credit as time went by as wages did not keep pace.
To tell you the truth, whenever I see that chart I do wonder what America would be like now if wages had kept pace with GDP. If you could game it all out and work out the likely paths of development, I suspect that most people would not recognize that alternate-America. In such an America there would probably be more stability and less class division. And there would never have been a Trump path to the Presidency.
Just because having the minimum wage of 1968 increasing to now the same way it increased from 1945 to 1968 would mean over $20 per hour…
That means a minimum wage worker could rent an apartment, maybe even a house, almost anywhere outside the Bay Area, Los Angeles, or New York City using today’s prices.
But then, in that world, we would probably have kept all the industries, all the businesses that we shipped out of this country, not because they weren’t profitable, but because it was more profitable to do so. That would mean that the Neolilberal Moment would not be in charge. There would not be hundreds of thousands of homeless people or a growing police state, but also the current Elites would not be charge and making bank.
I keep seeing the chart comparing average wealth based on race, but what I’d like to see is wealth disparity based on race. Maybe, just maybe, the woke would have to admit how many poor and exploited whites there are and that they have been doing the 1%’s work in exacerbating racial animus. Exploited people of all colors have more in common with each other than with the wealthy the pundits want to slice and dice them with.
It appears the article intends to stoke division by stating “average wealth” in the statements as average wealth can differ considerably by the actual distribution of wealth as a lot of very wealthy people can move the average to be much higher than the median (50% above/50% below)
The median wealth disparity is much less, in absolute dollar terms (purchasing power) and nothing like the 700k figure highlighted.
https://www.taxpolicycenter.org/fiscal-fact/median-value-wealth-race-ff03112019
Median white family wealth 171K
Black family 17k
Hispanic family 20K
While the median white family wealth (171K) is 10x the black family, the white family’s relative wealth (160K) may be represented in the equity of a mortgaged house, so there is not a lot of liquid wealth for college, medical care, or sudden expenses as there may be little savings to draw from.
If the family size is 4, then the median white family has about 42K of net worth per family member, and the net wealth would be zeroed out by one 4 year college degree at >160K.
At the median level, ALL groups are stressed, especially if they are out of work, but the white family has more assets to leverage as they can probably borrow against their house.
But mentioning the 700K delta average white family wealth figure is, I believe, good for headlines, but not an accurate portrayal of the median, financially stressed white family.
Exactly, except if you are out of work, you won’t be borrowing against your home equity no matter how much you have. Lenders look at cash flow first. And one of the first things to happen is that lines of credit get closed down and loan applications are denied. That has happened to me twice now in downturns.
2. Workers have not benefited from rising productivity
One might think then that ethical finance, including of automation, is important.
That chart has been shown to me as proof of automation but all it is proof of is the wage share of productivity being held down purposely using automation as a hand wave.
When I see these charts I always wonder how long things will continue down this road.
Currently the bottom 50% have 13% of the wealth. What happens when that goes to zero? What will it mean when the top 1% capture 30% or 40% or more? I see no correction in the future, only acceleration of what has occurred before. At some point this looks like feudalism, and the wealthy will spend significant time supervising their own personal security apparatus. Both to keep the serfs in line, and to wield against their competitors.
I remember Reagan winning the first time. I thought then, we had taken a fork in the road, and that the future would be much different going forward.
Eventually, there will be a Bastille Day. Protestors are already going to the homes of the Elite.
This was all laid out in the 1972 Powell Manifesto. After 58 years the coup d’etat is within the final grab of the One Percent. All it needs is a little ‘wet work’ to kill the Constitution by the fake ‘originalists’ on the Supreme Court. Invalidate just enough Biden votes to give Trump the electoral college. By Supreme Court fiat. As was done in Florida when the recount was stopped by the court with Bush ahead by 537 votes or some insanely small number. We are about to get an ‘updated’ version of the Florida technique. Courtesy of Supreme Court jurists who believe the 1787 Constitution ‘text’ is the final word on jurisprudence in 2020. Apparently most citizens fell off the turnip truck.
I wouldn’t underestimate Joe Biden’s chances of losing without any help from the SCOTUS. I don’t know how people can expect things to turn out differently with the Democratic party clinging to the same failed strategies time after time.
I don’t think the democrat strategies have failed at all. Their goal is to win just often enough to maintain some baseline level of credibility, but never enough to actually do anything.
I’d say they nailed it.
These are charts that the Democratic elite prefer to ignore, particularly those that reveal the ultra-rich prospered for the last 40 to 50 years as financial prospects of the 99& grew increasingly bleak, except perhaps for members of the PMC. During the last 40 years the country has 2 Democratic administrations and at times control of 1 or both houses of Congress. Yet the rich have continued to get richer and the poor have continued to get poorer.
Joe Biden has been in important positions since the early 70’s when things first started to better for the rich and worse for everybody else. He did nothing to counteract these trends. in fact he aided the rich in reaching their triumph.
Excellent piece Yves. Thank you.
Important to understanding how Americans vote. Trump may have benefitted from the tax and trade policies that created all these greed-head billionaires, but Biden drove them.
Most people would rather be stabbed in the chest than be stabbed in the back. At least you can go down fighting…
If you have a chance, look into Thomas Piketty’s new book: Capital and Ideology. It’s really fascinating reading. He shows all kinds of data, including how the composition of wealth varies with income decile. Some people in the middle theoretically have positive wealth but it is all tied up in their home; they’re just not liquid. Also fascinating to me is the discussion of different kinds of ownership societies, including slave societies with extreme inequality. When it comes to reparations, pretty much the only reparations ever made were to slave owners who lost their human chattal property. Freed slaves were never paid back for their years of labor and grief. In Haiti, for instance, the country had to pay off former slave owners for decade upon decade. It is outrageous how history has played out due to power ideology.