Lambert here: The health of the State?
By Zsoka Koczan, Senior Economist European Bank for Reconstruction and Development, and Maxim Chupilkin, Macroeconomic Analyst in the Office of the Chief Economist European Bank for Reconstruction and Development. Originally published at VoxEU.
Much of the literature on the economic effects of war has focused on specific countries or regions, relied on small samples, or spanned only brief periods. This column investigates the economic effects of wars drawing on a novel database of nearly 400 wars over the past two centuries. The authors find that wars fought on a nation’s own territory result in significant GDP per-capita loss; civil wars have more persistent effects than interstate wars; and certain kinds of conventional research may have significantly understated the long-term economic scars of war.
There is a small but growing literature on the economic effects of wars. A number of studies have pointed to significant negative effects, driven by the destruction of human and physical capital, disruptions to production processes, and heightened uncertainty (Abadie and Gardeazabal 2003, Cerra and Saxena 2008, Cappelen et al. 1984, Thorp 1941). Some, including in literature on the drivers of economic growth, have found no meaningful effects of wars on growth (Acemoglu et al. 2005, Barro and Lee 1994). Others have pointed to positive effects on output, driven by the effects of increased military spending, higher utilisation rates of labour and capital, or increased total factor productivity (Deane 1975, Olson 2008, Organski and Kugler 1980).
Many of these studies have focused on specific countries or regions within countries (Abadie and Gardeazabal 2003, Harrison 1998, Broadberry and Harrison 2005). Some restricted their analysis to only civil wars (Blattman and Miguel 2010, Collier 1999, Hoeffler and Reynal-Querol 2003). Studies of interstate wars have also typically relied on small samples, and often examined GDP losses relative to predictions based on the country’s own pre-trend, either shortly before the war began or based on the full time series (Organski and Kugler 1977, Wheeler 1980, Rasler and Thompson 1985).
Our recent paper (Chupilkin and Kóczán 2022) investigates the short- and long-run economic effects of wars, drawing on a large database of almost 400 wars over the past two centuries. The analysis is motivated by Russia’s invasion of Ukraine in February 2022; however, it takes a broad view of the history of conflicts (see also ERBD 2022).
We use a synthetic control method to examine both immediate disruptions due to wars and any long-term scarring, looking both at countries’ GDP per capita and, more generally, at any effects on their economies’ productive capacity: populations, capital stocks, and total factor productivity.
Existing studies have typically examined such effects by looking at much smaller subsamples of wars, using case studies, pre-trends, or mostly cross-sectional regression-based analysis. We contribute to this literature by using a combination of other countries – which did not experience wars and which resemble the country at war before the conflict – to construct a synthetic control. We then compare the subsequent economic evolution of this ‘counterfactual’ country without a war to the actual experience of the country at war.
Our analysis is thus most closely related to Abadie and Gardeazabal (2003), who introduced the synthetic control method and applied it to estimate the effects of terrorist conflict in the Basque country, as well as to Saxena and Cerra (2008), who documented the behaviour of output following civil wars and financial crises using impulse responses.
We construct a novel database building on the Correlates of War dataset, covering almost two centuries of conflict. This allows us to rely on a much larger sample than previous studies, including both civil and interstate wars, and to distinguish between wars on and off territory between winners and losers and parties initiating the war versus others. To illustrate the effect of the average war in the following figures, we compress wars of varying length into two typical war years by computing the average growth rate during the first and second halves of the war and treating it as the growth rate of the first and second years of the ‘typical’ war.
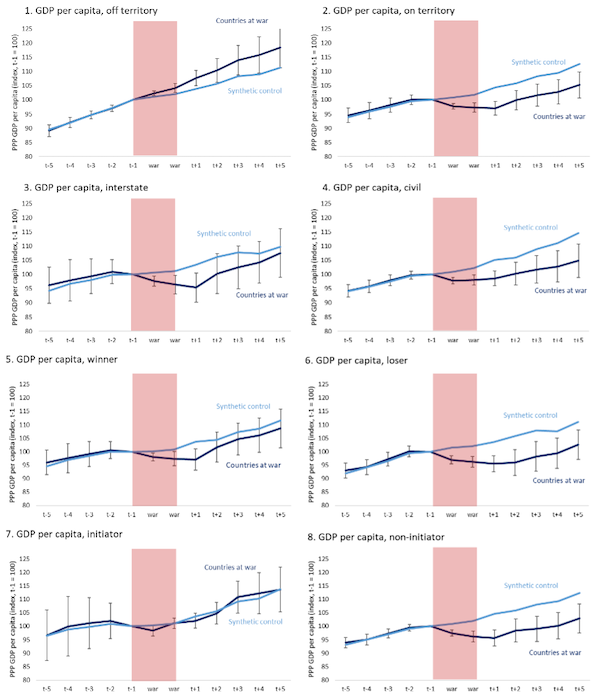
We find that GDP per capita drops are driven by wars on territory, with GDP per capita even increasing relative to that of comparators for some wars off territory, explaining some of the mixed empirical findings of the existing literature. Wars on territory result in a GDP per capita loss of over seven percentage points relative to a synthetic control the year after the war ends. Civil wars (which tend to be longer and are also more likely to remain unresolved) have more persistent effects than interstate wars. Losers and non-initiators also see significantly larger drops in GDP per capita than winners and initiators, respectively (see Figure 1).
Figure 1 Effects of wars on GDP per capita

Notes: In all figures t – 1 refers to one year before the start of the war; 90% confidence intervals shown. All civil wars are regarded as taking place on a country’s own territory. Interstate wars are coded as taking place on territory if there were substantial battles within the country’s own borders (excluding minor attacks, border disputes, and attacks targeting only military infrastructure). Other groupings follow the Correlates of War database, based on a general consensus among historians concerning which side won the war and whose battalions made the first attack.
We complement this analysis by also using a production function approach, looking at the effects of wars on economies’ productive capacity: populations, capital stocks, and total factor productivity (see also Vandenbroucke 2012, Broadberry and Harrison 2018, and Akbulut-Yuksel 2020 on the lasting effects of wars on population size, education, and health).
Our results here suggest that a focus on flows, such as changes in value added generated each year, may significantly understate the lasting damage from wars. Even where income per capita recovers, there are lasting scars to labour forces and capital stocks. While total factor productivity rebounds to its pre-war level about five years after the end of a war, the populations and capital stocks of countries at war remain significantly smaller (see Figure 2).
Figure 2 Effects of wars on population, capital stock, and total factor productivity

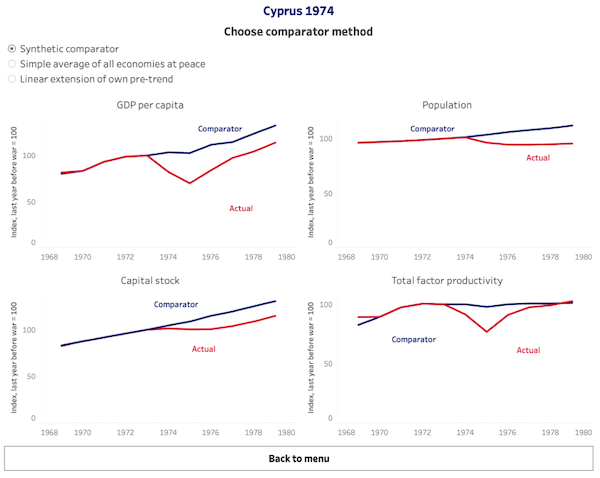
Our paper focuses on average results across all country-wars for which balanced data is available. The paper is also accompanied by an interactive online annex (the Economies at War Atlas), which presents individual countries’ GDP per capita, population, capital stock, and total factor productivity relative to three counterfactual paths: a synthetic control, a simple average across economies when not at war, and their own pre-trend (an example is shown in Figure 3).
Figure 3 Example of the online Economies at War Atlas

In addition to providing easily accessible information, the Atlas illustrates the benefits of the synthetic comparator approach relative to other methods. A simple comparison with all countries not at war tends to overestimate the negative effects of the war, while a comparison with its own pre-trend tends to under-estimate the ‘true’ effect. The Atlas also aims to increase transparency and mitigate concerns that the averages reported in the paper may be driven by outliers. For the large majority of country-wars, our synthetic comparator closely matches the variable’s own pre-trend before the war, with divergence starting at the time of the war. Finally, we hope that the Atlas can point to avenues for further research; for instance, by enhancing our understanding of the significant heterogeneity in country experiences beyond the typology of wars and the mechanisms behind economic recoveries.


Wrapped around an axle this morning and don’t have time to do more than scan but it would seem that who bears the “the long-term economic scars of war” and who benefits in the short and medium terms are the important questions. The answers do not lie in calculations of “GDP” (keyword: gross)…Anyway, the health of the state? Indeed Randolph Bourne wrote War is the Health of the State just before he died in the Flu Pandemic of 1918. Should be required reading.
Along with War is a Racket by Smedley Butler.
Perhaps one reason cable TV etc are obsessed with WW2 is that that war–the “good” war–put the US on top. War is the health of the winning state? Whereas the losers are left in a condition that brings forth monsters as with post WW1 Germany or my own South whose racist history has a very great deal to do with the post Civil War poverty that persisted up to the mid 20th.
WW2 is the last big war we won.
Cotton, had all the signs of being a huge bubble, including the ramping up of leverage. The bubble was bursting right as the war was starting so the bursting part of the bubble was swamped under the general war condition. All this occurred just as the Western US was going to open up via RR and the great lakes connections.
Given the generally poor soils in much of the South, leading to greater population dispersion even without cash crop plantations, the general lack of industrial development, most of the South was going to be in a very bad place even without the war.
The rise of the South corelates very well with the rise of the internal combustion engine and air conditioning.
Parhaps a primary reason the US is so warlike is because after the civil war (and excluding one-time attacks like Pearl Harbor/9/11) we have been the generous beneficiaries of the Atlantic and Pacific, and not had war on our territory. For an empire where war is always on others territory (and usually, poor, poorly equipped, brown skinned peoples) even losing isn’t bad as long as the MIC always wins (hint: it does). And the poverty of a completely destroyed Europe after WW2 was what allowed us to dominate the post-war economy moreso than our booming wartime production… we simply took over while they had to rebuild. So the GDP gain can be relative (i.e. if everyone else loses 20% of their capital stocks/labor force and we lose 5% we are 15% ahead) and obviously the money all flows to the top (MIC, politicians, army).
And there are obviously extra benefits for maintaining international hegemony for the hegemon. Even if the price is dear and other countries unfortunately have to be destroyed to flex our power. Now that we are losing our hegemony we are lashing out like a child and taking everyone else down with us.
The inefficiency of war-time economies mirrors the inefficiency of a political system in which a million dollar bribe/campaign donation can yield a billion dollar munitions contract.
…and yet only half a billion worth of munitions.
Isn’t it interesting that we can discuss the costs and benefits of war? It seems that humanity is mostly inhuman.
The normalization of insanity.
eyeroll.jpg
The very first chart in the first figure tells us everything we need to know about US reasons for meddling about militarily internationally. It’s good for business, period.