Yves here. While this study has an interesting objective, of seeking to measure changes in attire and hair styles as a proxy for style conformity, I have doubts about high school yearbooks in the 1960s and 1970s being great proxies. There was a great deal of resistance in schools to relaxing dress codes; recall girls wearing skirts above the knee (when miniskirts were in vogue in the 1960s and the original Star Trek showed a lot of leg) was generally verboten, along with pants, and jeans were absolutely not permitted as school attire.
Note in particular that this study uses 1966 yearbooks showing boys in suits and conservative haircuts.
My father graduated from Harvard Business School in 1965 and was the oldest member of his class. When I was cleaning out the house last year, I found a business school picture of him from his section. It looked like a photo of an exam. My father and four classmates were in the shot, all in profile. My father was in a suit and had short cropped hair. The other men had sideburns and long hair and were dressed as if they were auditioning to join the Beatles.
By David Yanagizawa-Drott, Professor of Development and Emerging Markets in the Department of Economics University Of Zurich. Originally published at VoxEU
Style choices are an important dimension of culture and are often used to demonstrate individualism or belonging to a group. This column uses over 14 million images from high school yearbooks to track cultural change in the US over space and time. Style characteristics of men and women converged from the 1960s onwards, driven by higher individualism and lower style persistence for males. Furthermore, it shows that novel style innovations predict patenting rates, suggesting that cultural change can facilitate innovation in other areas later in life.
Picture yourself strolling through the hallways of a 1950s American high school. The scene is a sea of conformity: boys with crew cuts, many sporting jackets and ties, while girls don demure dresses and perfectly coiffed hairdos. Fast forward to today, and you be greeted by a kaleidoscope of colours, hairstyles, and fashion choices that would make your head spin. This stark contrast serves as a potent reminder that culture is far more than just a set of beliefs and attitudes – it’s a way of life, constantly evolving and shaping society.
Recent years have seen considerable progress in analysing culture as a ‘way of life’, using data on consumption patterns, folklore, and naming patterns (Bazzi et al. 2020, Michalopoulos and Xue 2021, Atkin 2016). To analyse style choices as a key dimension of culture, we need two things – data, and a way to make them speak. In our study (Voth and Yanagizawa-Drott 2024), we use portrait photos of high school seniors in the US, 1950-2010, to track cultural change. The idea of using photographs as a window into social trends is not new. Francis Galton, the Victorian polymath, infamously used composite images to create ‘archetypal’ faces of criminals and prostitutes (Galton 1878). Thanks to the wonders of machine learning, we can analyse cultural shifts on an unprecedented scale. In an important recent study, Adukia et al. (2022) used images in children’s books to trace racial stereotypes. In our study, we examine more than 14 million images from 111,000 high school yearbooks to track style choices over time and space.
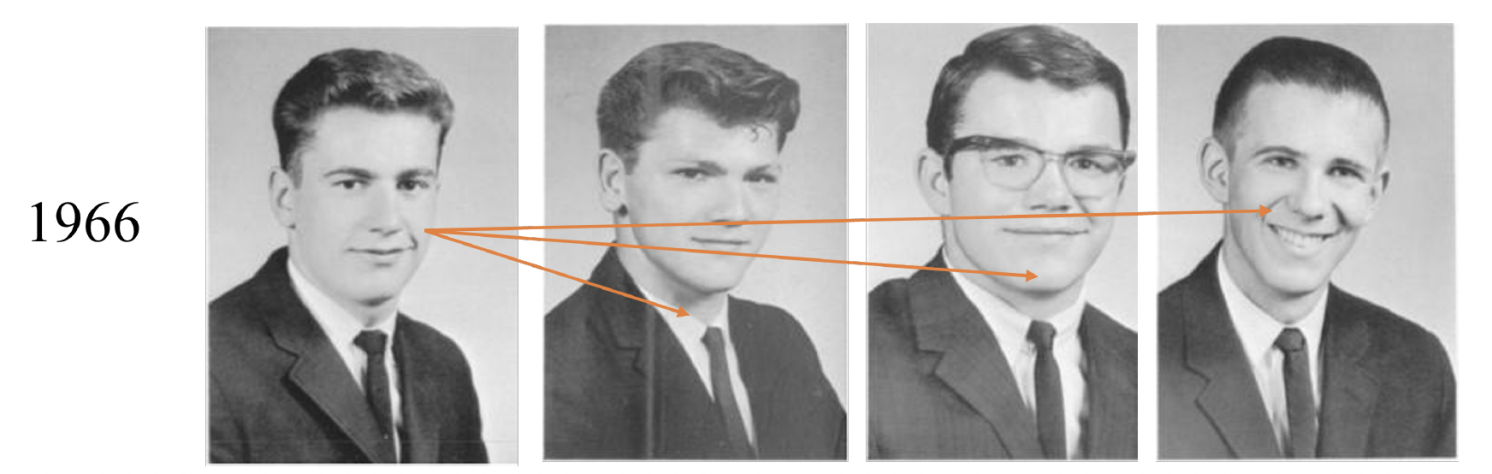
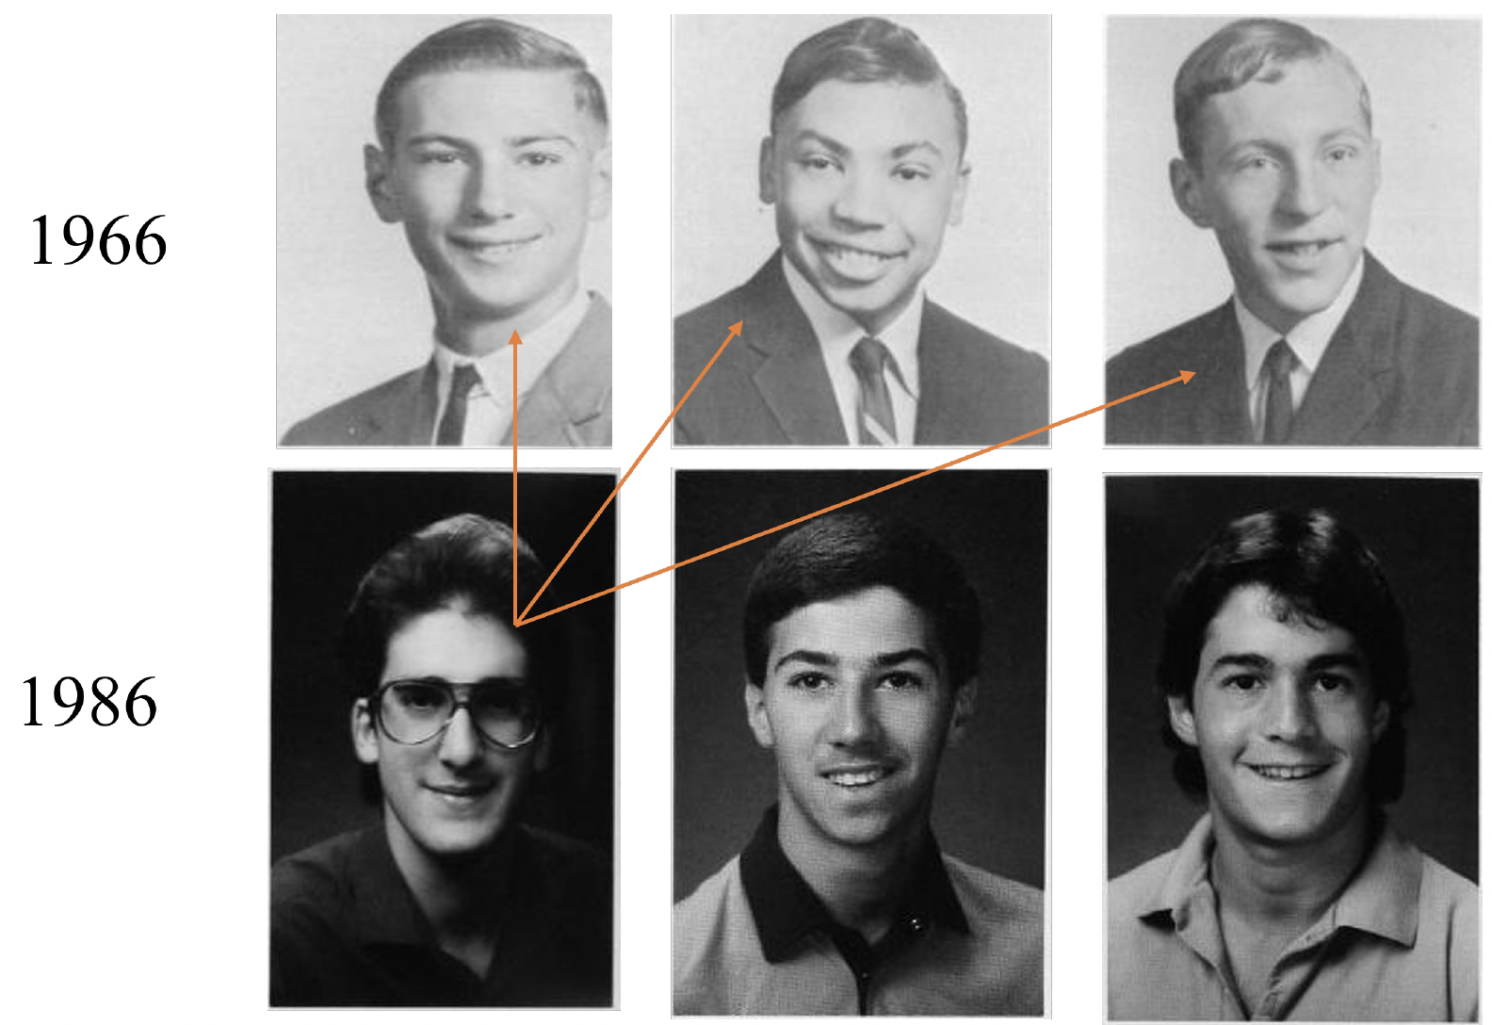
We use three main concepts: individualism (how many students within each high school dare to have a different style from their peers), persistence (similarity between present styles and those of 20 years prior), and style novelty (the emergence of previously unseen style choices). Consider Figure 1, showing portraits of graduating seniors from Attica High School in New York in 1966. We can see that they wear very similar clothes – dark suit, tie, collared shirt, no facial hair. We calculate a high measure of similarity based on their style choices of 0.9. The same style of calculation underlies our persistence analysis. We compare cohorts with graduates from the same school 20 years earlier (Figure 2). In panel A, we have low persistence – style choices changed dramatically. In panel B, differences are much smaller, except for some more exuberant bow ties and longer hair. Accordingly, we calculate a high persistence score.
Figure 1 Individualism calculation
 <
<
Notes: This figure illustrates the calculation of the individualism score. For individual i, it is calculated as (1-mean cosine similarity) when compared with all the images of other seniors with the same gender in the same high school cohort. The score for the individual on the left is 0.098, indicating a low level of individualism, since most style choices (suit, hair, tie) are similar.
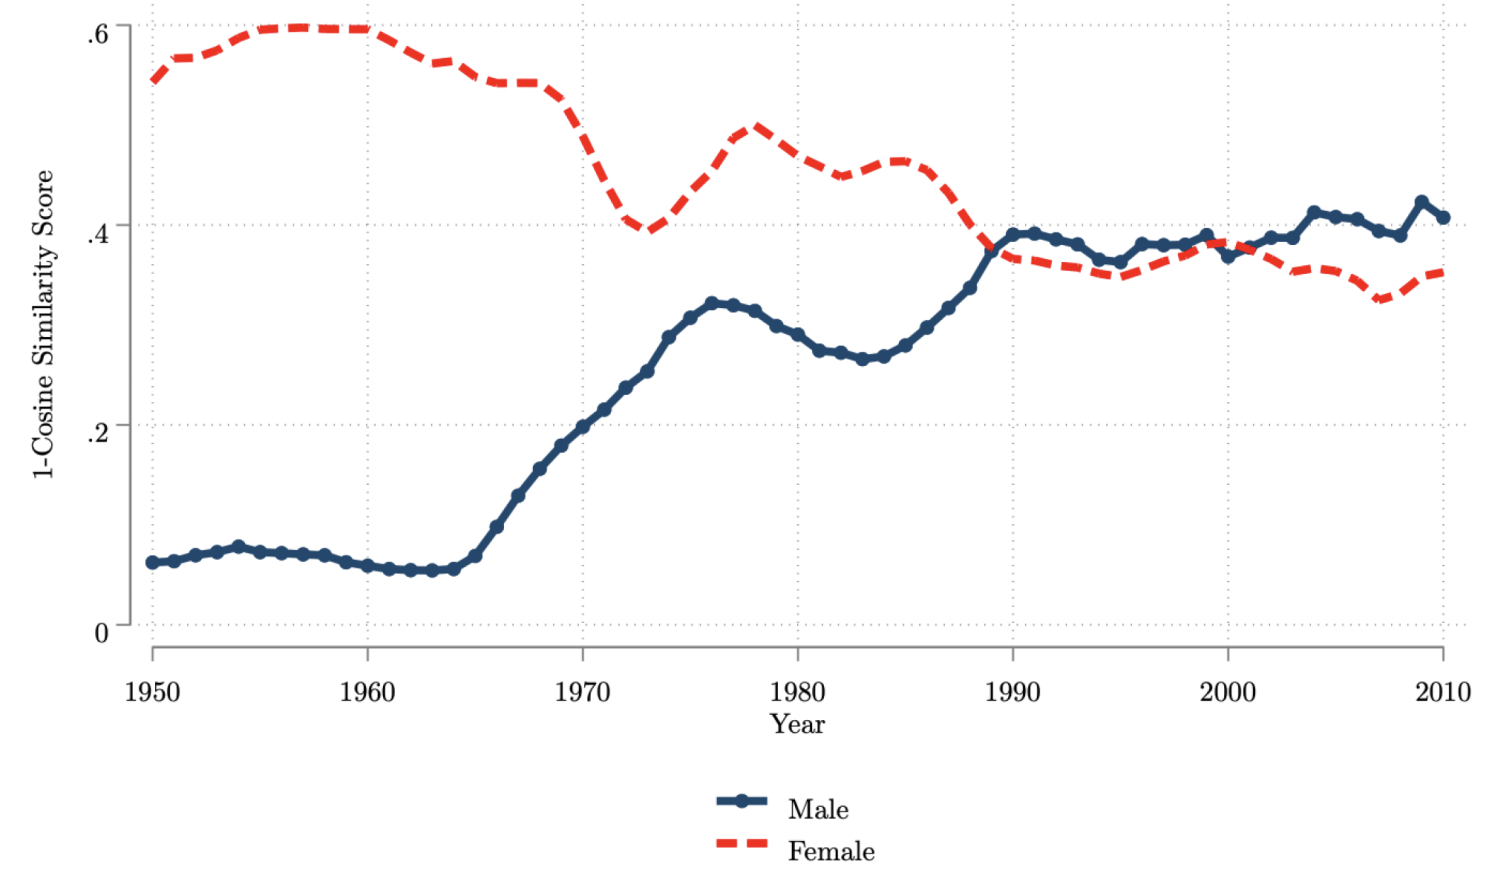
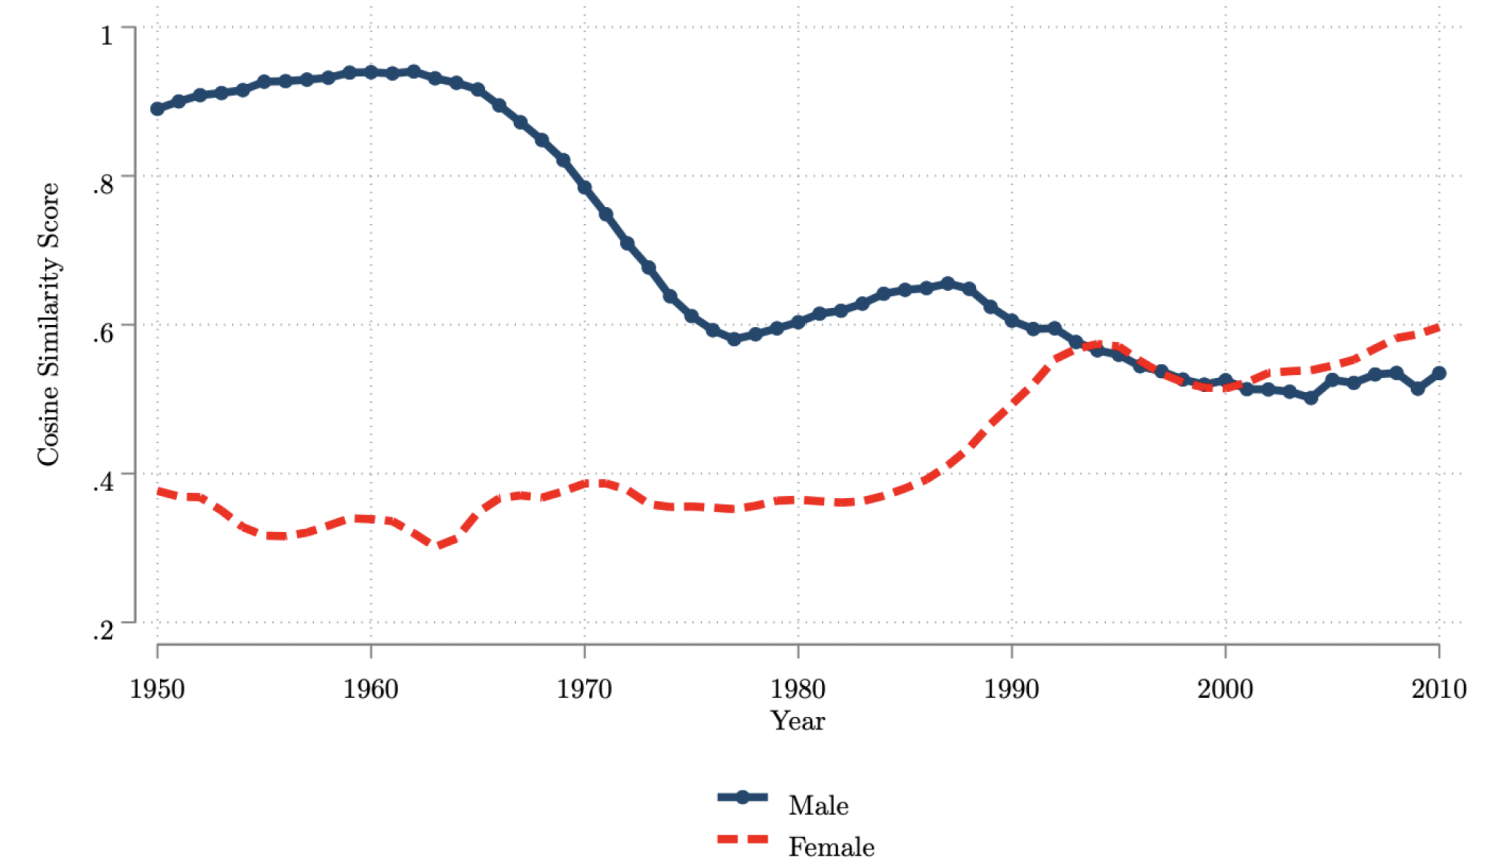
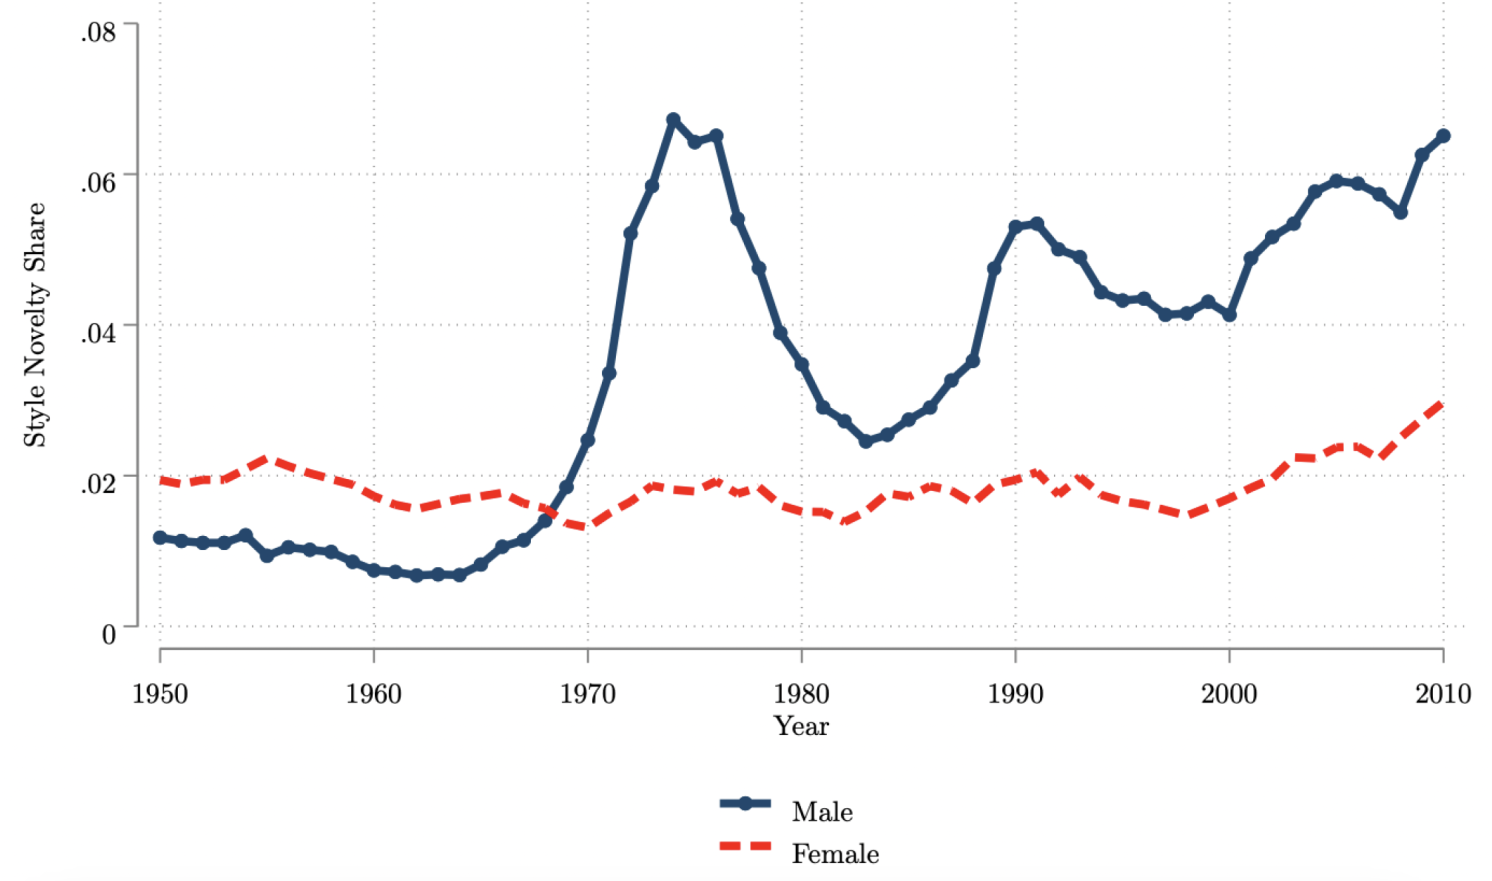
These indicators allow us to paint a fascinating picture of cultural evolution in post-war America. Figure 3 gives an overview. The main message is that style characteristics of men and women converged from the mid-60s onwards, as the women’s rights movement erupted and old role models were laid to rest. Both individualism and persistence levels converged by the 1990s.
Men started out in the 1950s and early 1960s with low individualism. They mostly looked like their parents, 20 years earlier. But as Bob Dylan prophesied, the times they were a-changin’. This equilibrium spectacularly collapsed in the late 1960s, with individualism surging. In the following decades, individualism continued to fluctuate around a rising trend.
In contrast, women started off with a lot of within-class variation (‘individualism’), and then saw a decline from the 1960s onwards. At the same time, persistence began to rise from the late 1980s, approaching male levels. Both genders experienced a marked increase in style innovation. Male style novelty exploded in the late 1960s, and both genders reached unprecedented levels by 2010.
Figure 2 Persistence
a) Low persistence example
b) High persistence example
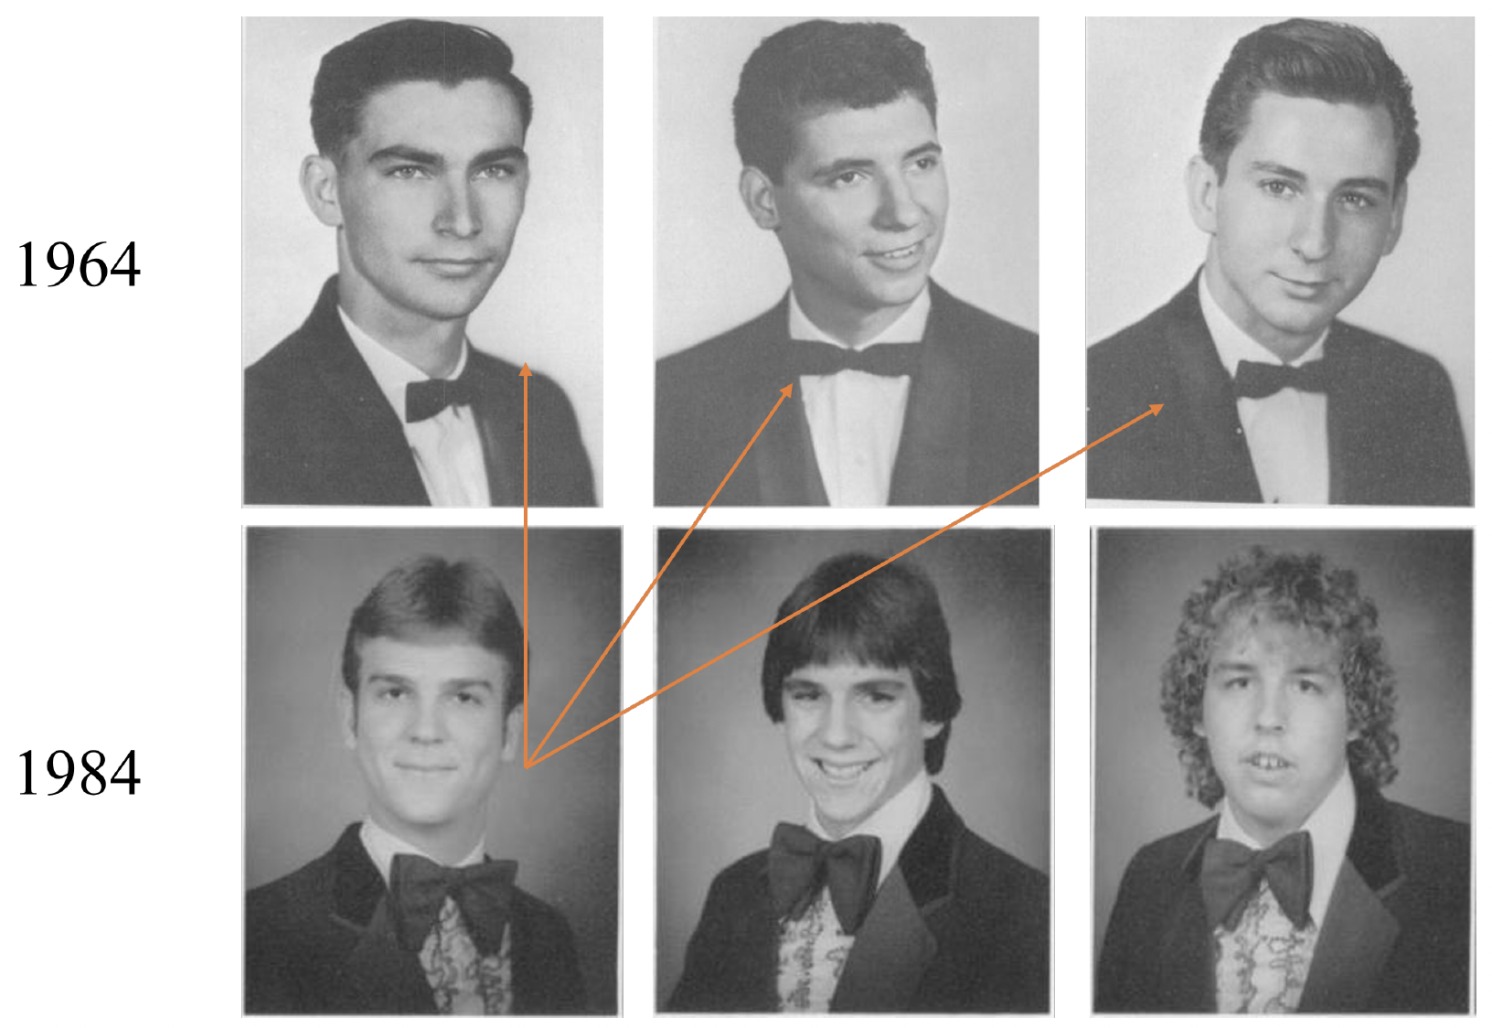
Notes: The figure illustrates the calculation of persistence scores. We calculate the similarity of everyone in a cohort, comparing each of them with the style of graduates 20 years previous (of the same gender). We then average this score for the cohort. Panel (a) is an example of low persistence (0.056). Panel (b) is an example of high persistence (0.83).
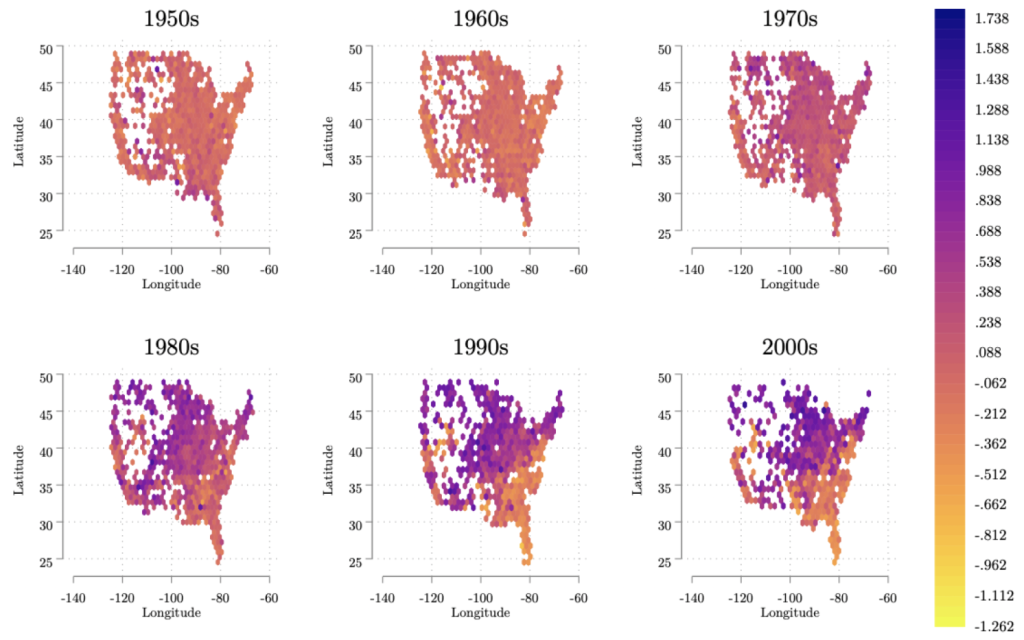
We find high and uniform levels of individualism and persistence during the 1950s and across schools. By the 1980s, however, a stark divide began to emerge. Schools became polarised, with some clinging to conformity while others embraced individuality with gusto. Perhaps unsurprisingly, much of the old South remained a bastion of style conformity.
Figure 3 Individualism, persistence, and style novelty over time
a) Individualism
b) Persistence
c) Style novelty
Notes: This figure plots yearly average cosine (for persistence) and 1-cosine (for individualism) scores for individualism (Panel A) and persistence (Panel B); Panel C plots the share of style innovators. Averages come from our image level dataset (14.5 million observations), split by gender.
Figure 4 Individualism over time
Does any of this matter beyond the realm of fashion and hairstyles? Should economists care about necklines and ties in high school yearbooks? As it turns out, there are potentially some significant economic implications. We examine whether style novelty goes hand in hand with technological innovation. To fix ideas, consider the case of one 1972 Cupertino high school graduate – Steve Jobs. Jobs appears with bow tie and tuxedo, sporting long hair and no beard or moustache. At this point in time, fewer than 0.3% of US male graduates had ever worn this style, qualifying him for the ‘style innovator’ category. Jobs also went on to apply for 1,114 patents, of which 960 were granted.
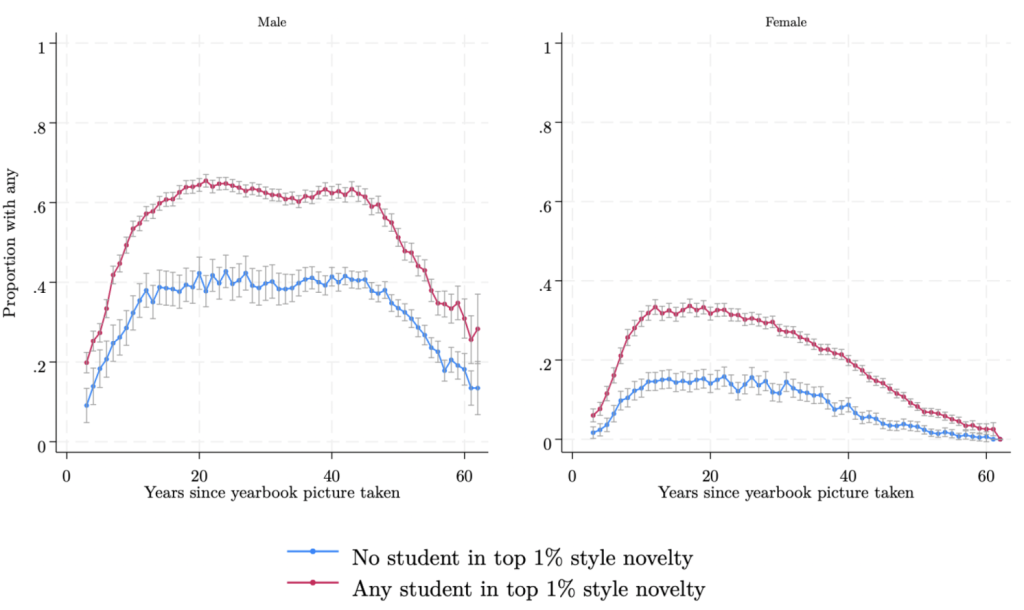
To see if the case of Jobs generalises at the level of the high school, we carefully match style innovation in a commuting zone with patenting rates of those born in that commuting zone, 18 years prior (using data from Bell et al. 2019). Tracking their successful innovation later in life, we find that areas with more style innovation also see greater patenting. Figure 5 shows the results – in every year after graduation, students from high schools in areas with style innovators are markedly more likely to apply for (and receive) patents. While handing out earrings to boys and cutting Mohawks will not necessarily raise technological creativity, schools that permit one of these style innovations may well also produce graduates that excel at the other. Given that innovation is a key driver of economic growth, these findings suggest that growing up in an environment with a little rebellion in one’s youth might pay important dividends down the line.
Figure 5 Patenting in commuting zones with and without style innovators, by year since graduation
So, the next time you flip through an old yearbook and chuckle at the outdated styles, remember: you are not just looking at a sequence of fashion oddities and funny expressions, but also at an important dimension of cultural evolution – and one that might have a serious impact on the pace of technological change.
See original post for reference

Does the study conformally map onto the photos known narratives of the years they were taken?
I graduated in 1991 and there was a ton more style innovation then compared to walking the halls of my son’s HS now. Everyone pretty much dresses the same now in athleisure (no more cliques of hip hop kids, straight edge punk, conservative kids in bow ties etc like there was)
I don’t believe this study for a minute, even though they used 14 million images. Using high school yearbook’s photos is a very artificial way to look at a society in that year as those are deliberately posed photos and not natural at all. That is why you still see guys wearing suits even in the 80s. I would go so far as to say that this is actually a lazy way of sampling a population. It would be far better to study images of street and campus scenes where people were going about their business in the clothes that they habitually wore. If you look there are plenty to be found and you could recruit people to send in images of street scenes that they have taken over the decades as well.
I agree. As a 1964 hs grad, I still remember going to the yearbook photographer’s studio wearing the required coat and tie and having the photographer determine, after directing me through various poses, which ones would be suitable for the yearbook. There was plenty of style individuality among my 400 classmates, but one would never have known it from their yearbook photos. A lazy analysis for sure.
Agreed. It’s like “Let’s assume an orthogonal design (i.e. everyone in every possible pose) but use a dataset where everyone was posed in 1 out of 64 (I chose 64 as a power of 2) possible poses to fit an empirical model”.
i.e. trash.
Exactly–didn’t really feel this told us anything. Your approach is much more valid.
Agreed. It’s a study of how tightly the yearbook’s inputs have been regulated and varied over time. For example, my dad graduated in 1969 and his yearbook picture looks like your standard 1960’s picture (it was probably a prescribed appearance style). His 1969 yearbook had zero picture or references of teen drinking in the yearbook, yet I know from family history there was plenty of that going on by MOST older teens in the community. When I graduated from the same HS in 1989 seniors could wear basically whatever they wanted for their picture AND in the yearbook there were multiple (and known, not missed – I was the editor that year) pictures of teens at parties and drinking AND this wasn’t new in 1989! And given my family knowledge and 100+ years of living in this community; the percentage/amount of accepted youth drinking had not changed in decades or more. Yet I also have good friends whose kids are graduating from that same school in the past couple years, and I can promise you there is way more external control over what goes into that yearbook now than probably ever.
Yearbook pictures reflect the values of those with control over what goes into them. It’s a reflection of what those exercising control over the yearbook want the community portrayed as.
Agreed. It’s not really possible to say anything about style preferences for society overall from this.
If the methodology is consistent through the years then it’s definitely measuring something – the question is what. It could be the degree of authoritarian control in schools, for example, which would offer a completely different rationale for the correlation with patents. I might hypothesize that greater freedom in school would be positively correlated with patenting and creative careers, and negatively correlated with military or law enforcement careers.
All that simple studies like this can show is correlation, though.
we had a dress requirement for our senior pictures ’71
The clothes that teenagers wear in high school yearbooks rarely relate to what they wear in everyday life, and their parents have a lot of influence on what they wear (typically buying the clothes for them, and putting pressure on them to wear them. Also schools often have rules about what is and isn’t acceptable.
I’m sure this is telling you something about social expectations of ‘smart’ dress, as well as the ways Americans ideals about graduation self-presentation have changed over the past 80 years, and the influence of parental norms – but the claims of the article seem really dubious to me.
Very lazy scholarship.
Kids tend to conform. The boys at my sons’ school have a fairly relaxed dress code (collared shirt, shorts with a belt, closed toe shoes or a school branded shirt, formal Mass dress) but their mothers all seem to shop at the same two or three stores and the boys almost all have the current trendy fluffy, curly hair. It’s hard to tell which kid is yours from a distance. My boys’ tennis hats barely fit on their heads.
I think it’s more about parental influence than conformity. I enjoyed picking out interesting clothes when I was a child, because my mother did, and it rubbed off on me. Over time I lost that interest and I now dress for comfort, value and to blend in. I dislike it when people notice what I’m wearing, for any reason. I know other people who went in the exact opposite direction.
How come nobody remembers the classic cultural takedown in the National Lampoon 1964 High School Yearbook?! It was the biggest selling special edition of a periodical magazine in history. And hilaarious. Oh my dear lord bless Doug Kenney’s soul, wherever he may be. What a world.
https://en.wikipedia.org/wiki/National_Lampoon_1964_High_School_Yearbook_Parody
I was reared on MAD magazine and made the leap to National Lampoon in the 70’s, and somewhere in a box in the garage is my 1964 Nat Lamp high school yearbook!
Let’s not leave out P.J. O’Rourke and his effort~
PolitenessMan was always my favorite cartoon, by the way.
PolitenessMan was always my favorite cartoon…Didn’t he wield (hurl?) a steel hankie? He’d make a good Parliamentarian.
Same here. Mom bought me a MadMag subscription as a birthday present when I was 11/12 and she then canceled it after she read an issue. (Born 1920.) I converted to NatLamp around 13/14 and I think she may have regretted the MadMag kerfuffle.
Most of The Three Stooges shorts were during the Great Depression and they were wearing suits.
Maybe so.
But everyone and everything looks like crap now.