Yves here. Rajiv Sethi stresses a key point: that presidential-election-impinging events have been so far out of band as to render many of the correlations in statistical models useless. Sethi has more faith in prediction markets. I would not be so positive. Less bad does not necessarily mean all that good. One can point to many prediction market failures, some highly visible like the forecast that the Brexit referendum would fail by four points when it won by two. Barry Ritholtz has been a long-standing skeptic. You can take a gander through his many posts and articles on this topic here.
By Rajiv Sethi, professor of economics at Barnard College. Originally published at his website
This has already been the most astonishing election cycle in living memory, and we are still three months away from the finish line. A history of the season could fill volumes. But many of the major events that have shaken up the presidential race can be detected in the movement of prediction market prices, which compress and reveal a lot of information in a very compact space.
The following two charts, viewed together, tell much of the story so far and allow us to contemplate counterfactual scenarios in an interesting way. The figure on top shows the prices of three contracts in the presidential winner market on PredictIt, while the one below shows the prices of contracts that reference the winning political party:
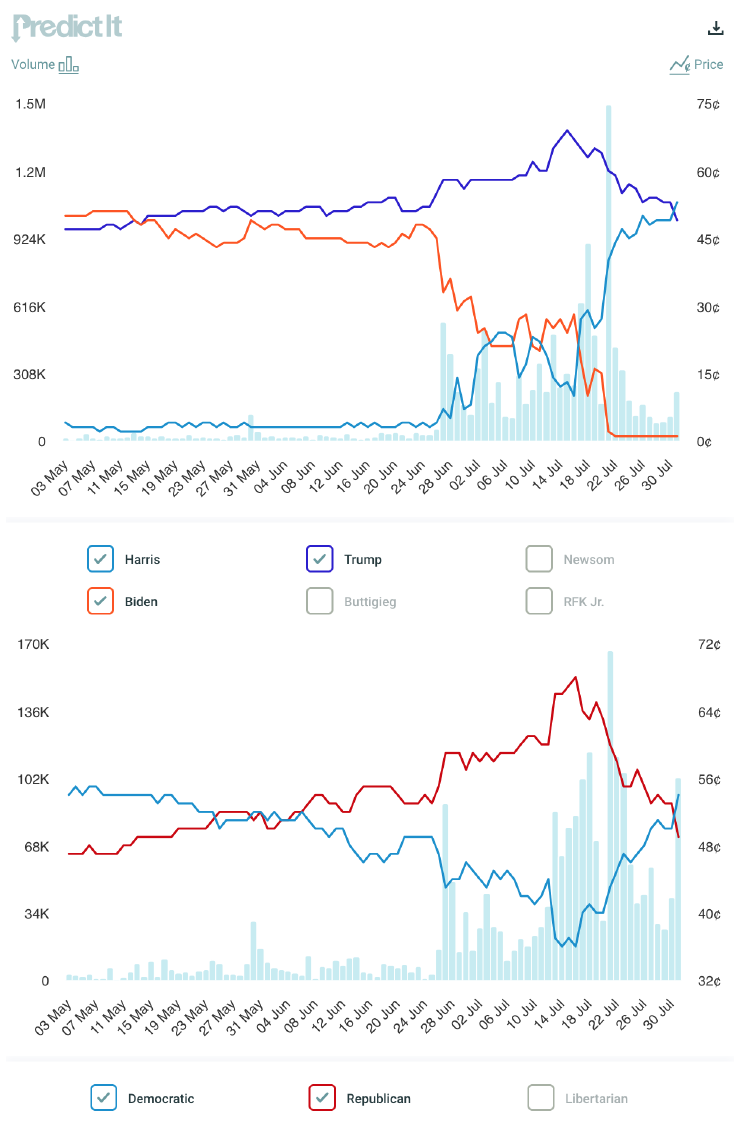
Many significant events—the debate, the pressure on Biden to step aside, his resistance to this pressure, the attempt on Donald Trump’s life, and the coalescing of party support for Harris, can all be seen in the oscillations above.
In early May, markets gave Biden a slight edge in a contest that was expected to be close. By mid-May Trump had moved ahead of Biden in the probability of victory, but the Democrats remained ahead in the party contracts—traders were assigning some probability to Harris (or someone else) replacing Biden at the top of the ticket.
In early June the party contract prices crossed, but the gap remained relatively narrow until the debate on June 27.
During the debate the price of the Biden contract fell sharply, as did the price of the Democratic contract, while the price of the Harris contract rose. These trends continued as pressure mounted on Biden to step aside, with Harris eventually overtaking Biden in the presidential winner market in early July.
The prospects for the party kept tumbling during this period of uncertainty, with increasingly public calls for a new nominee even as Biden and his supporters insisted that the matter was closed.
The assassination attempt came on July 13, and led to a sharp increase in the likelihood of a Trump victory. This probability peaked a couple of days later, and then started to decline in tandem with a rise in the price of the Harris contract. By the time Biden formally stepped aside on July 21, the gap between the parties had already narrowed substantially.
As soon as the decision to step aside was announced, the price of the Biden contract collapsed completely and the price of the Harris contract surged. The gap between the two party contracts narrowed, and continued to narrow over the next few days.
Yesterday, for the first time since early June, the likelihood of a Democratic victory edged past that of a Republican victory in this market.
One can use these charts to consider a counterfactual scenario. By the time of the debate, Biden had already trailed Trump for six weeks. Had there been no debate, this gap would likely have persisted, but remained small enough to prevent a serious challenge. What the debate did is to expose vulnerabilities early enough for action in the face of panic, rather than resignation and paralysis. When people look back on this period, the debate debacle might be seen as a blessing in disguise for the party. It opened up the only possible avenue for a competitive election in the November.
This election season has exposed the limitations of statistical models when we are faced with significant departures from historical norms. Once it became clear that Biden would not be contesting this election, models based primarily on opinion polls were suspended and had to be revised and recalibrated to accommodate the change in presumtive nominee. One of these is now back online, but the others remain silent.
Markets, meanwhile, adjust instantaneously to changing circumstances. They tell an uninterrupted story, accommoding all manner of twists and turns. And they establish a precise historical record that can supplement other sources of information once these events start to recede into the distant past.


This reinforces my perception that the decision to have Biden “debate” Trump early was a “stab in the back” to Biden by his own Party. It ‘conveniently’ happened early enough to allow a fairly “drama” free transition from Biden as candidate to whomever else the Party wanted at the top of the ticket. This happened early enough that Harris can also be “allowed to fail,” and some more Party Insiders approved candidate can be slipped into the top spot on the ticket.
One, the election is Trump’s to lose.
Two, the Democrat Party candidacy is Harris’ to lose.
Three, the Democrat Party has reverted to type. This candidate will be determined in a vape filled back room over a Party Zoom call.
Four, the Ghost of Biden is wailing in the outer dark: “Nothing will fundamentally change.”
Five, Harris now owes me $600 USD. (She inherited that along with “Creepy” Joes’ campaign war chest.)
Six, what does the accession of Harris to the top spot in the Democrat Party ticket do to the Rapture Index?
Stay statistically safe.
Calling it a “stab in the back” puts too fine a point on it, even if I loosely agree with this interpretation of events. Biden’s been cooked for years healthwise, and I’m sure very nearly ever person around him knew. I think Dean Phillips also decided to play the role of enfant terrible, saying the emperor had no clothes, but he was just a little too quick on the draw, said it before the party was ready to publicly acknowledge the simple truth.
My take is that the people in control of the Democrats wanted to avoid a competitive primary at all costs. This was because of the ethnic cleansing currently occurring in Gaza first and foremost, which the party had no intention of addressing in any meaningful way (and still doesn’t). They needed to keep all that sweet AIPAC money flowing into their coffers so the opportunity to Weekend at Bernie’s Biden through primary season was too tempting to pass up. They rightly understood that everyone knows it’s a Quixotic fool’s errand to run against a sitting president in the primary, and the knew if they could just kept Biden out of the spotlight long enough to maintain plausible deniability about his dementia they could make it work. Everyone would just write replacing Biden in the primary off as a lost cause, which they did, and that would settle it. It wasn’t just Gaza, there’s a whole slate of issues the left leaning part of it’s voting base wants the Democratic party brass doesn’t want to touch with a 10 ft pole and risk raising the ire of their paymasters.
Cue the early debate, where they planned on letting the world know his true condition. I agree that Biden was 100% set up to fail. I think they vastly underestimated how stubborn Biden and his inner circle would be, as well as how elected Democrats in Congress would still carry water for him and say the naked emperor’s suit of clothing was still beautiful. This regrettably included Bernie and the Squad, in a truly shameful display. They knew once they installed Harris, with a good media blitz Democratic voters would fall in line (which they overwhelmingly did) and that could basically keep the unpleasant business of actually offering the left anything on the backburner for another 4 (and potentially 8) years. By then whatever was going to happen in Gaza would have probably run its course and since the typical voter has a memory that traces back about 3 days, it would all be water under the bridge.
That’s how I think this all went down.
Well, PredictIt says one thing, Polymarket says another. How should we evaluate multiple markets?
Three questions:
(1) How much money is riding on this PredictIt market? Do we know? Polymarket shows the $$$, and it’s a hefty amount. I’d be curious to compare.
(2) PredictIt shows the following for active shares:
Biden 1,140,633
Trump 1,599,631
Harris 1,158,564
Volume on Biden is very low — only 2 transactions today — so what’s up with these numbers? Dementia Joe for the win? Lotta ppl hedging, or… ? I guess it could be argued that many people are just waiting for the convention, or haven’t touched their orders recently, but the latter sort of undermines the “markets adjust instantaneously” claim.
(3) Finally, what about all the ppl who bet on Harris, not because they actually want her to win or believe she will, but simply because the odds were better and they want to cash in? Greed is good, right?
1. I don’t see how Predictit’s odds can be different from Polymarket’s for the same event, since you could arbitrage the difference. I haven’t looked at Predictit though. I’ve been following Polymarket. I looked briefly at IEM.
2. I noticed that as of last night, Polymarket was at 45% for Harris winning the election, and 70% for her winning the popular vote. If my math is right, that means in the situation where Trump wins the EV, there’s still about 45% likelihood of Harris winning the PV like Clinton did in 2016. I hadn’t realized that situation could be relatively likely.
3. Despite that I would say post-election whining about the popular vote, like we still hear all the time about Clinton, has no credibility unless it begins before the election. Otherwise it’s trying to have it both ways.
At the moment, PredictIt says Harris 55¢ Trump 50¢, while Polymarket says Trump 54¢ and Harris 44.5¢.
There have been comments at Polymarket about arbitraging, so maybe it’s happening?
Regarding my question #2 above, a buddy pointed out that liquidity may be so low on shares of Biden, that perhaps those 1.1 million shares are stuck.
I.e., “Biden bag holders” :D
Meanwhile, I must agree with DJG, Reality Czar’s take, below, about the “strong whiff of unreality” in this.
Not so easy to arbitrage, given $850 contract limit on PI, which also makes PI harder to manipulate. I suspect there is more attempted manipulation on Poly, but the main reason for the disparity is segmentation.
To amplify the point, from Predict:
Polymarket is closed to US persons:
Yes, exactly, thank you. PredictIt is not perfect but hard to beat consistently, quite reliable in my opinion.
Yes,Polymarket is much more transparent. You see every trade, the price and the traders.
To be cynical, if I was a Dem-friendly megadonor,, I’d distort the PredictIt market.it wouldn’t take that much money (each contract is ~50 cents), and you literally spin the news cycle.
My graduate school statistics is a bit rusty, but here goes. It is highly likely that polling models will either perform very badly this cycle, or they need to time to adjust. The basic statistical formulation of taking a sample, say 1,000 respondents, then mapping that to the expected turnout and composition of the actual electorate only works well when you have the latter correct. Given all the events and turns, and the lack of prior events to model against, adds a level of complexity to modeling (which is what polling is) very hard at best. To think, despite any best efforts, that the polling organizations have been able to adjust their end point models quickly is silly.
As to prediction markets, just like Vegas, they need a balanced book. So “odds” are not always what they think will happen, but what they need to manage their payout risks.
“So “odds” are not always what they think will happen”. Indeed. Lesson one in discrete choice modelling is catching out the students by presenting them with two sets of logit regressions (purportedly for the same condition and all the same independent variables) with wildly different magnitudes of beta coeffiients and asking them if these are comparable.
Correct answer is “yes, if the pattern of odds – and ideally the odds ratios – for the various variables match”. Absolute numbers matter little. The Odds change largely due to the confidence/certainty/consistency of the people providing the data.
If I see a state poll where the “Kamala effect” has been “priced in quickly” then I’d expect the percentages to be close to what we’ll see on election day. On the other hand, if the populus in a state is still very “up in the air” over what this all means then percentages will naturally skew closer to 50/50 (in terms of two-party support, it gets a little more complex if RFK Jr is a viable candidate for more than a trivial number of people).
I had a quick look at betting numbers on the 2024 nba finals, which we know the outcome. My (often wrong) quick take is take these numbers with a grain of salt. At Legal Sports Reports we see that 85% of the tickets and 80% of the overall money was backing Dallas, who proceeded to get smoked by Boston.
This is not an even comparison by any means. Sports betting involves odds (to protect the bookies).
Considering how savvy Sethi’s other columns posted here at Naked Capitalism have been, I’m having problems with the poor set of hypotheses that this column is desperately trying out.
—Markets are not electoral polls. We are back to the fantasy land of markets as perfect information. Does anyone even know who is trading these shares and puts and such? Does the average voter have the money or interest to be dabbling in such stuff?
—The charts assume only two candidacies, the Democrats and the Republicans. Yet no one seems to be willing to measure the effects of RFKJr, the Greens, the Libertarians (who regularly poll much more than analysts are willing to admit), the damp squib Cornel West (oh, well).
As your reality czar, I’m getting a strong whiff of unreality.
As ever, Americans are twirling and swirling and hurling toward freedom. Only ninety days!
I think this election is hard to handicap. There are too many moving parts and external issues that lack resolution. But there is one dynamic that does not seem to be emphasized enough, i.e., the mainstream media’s effect. If you look at the major media outlets they are all in full-propaganda mode. Every story is anti-Trump and, at the moment, pro-Kamala and that is everyday in every way. Eventually propaganda memes are digested by the American people as truth. Yes, there are loyal Trump voters but can they swim against the tide of TV news? Propaganda almost always seems to work and that propaganda has been relentless since Trump was elected. Can Trump counteract that? I would bet on Harris because no negative pieces about here can be published in the mainstream or so it appears.
When people look back on this period, the debate debacle might be seen as intentional. in order to not have a voter infected primary.
“Our democracy!(tm)” does not include the hoi polloi, the commoner, the working class, the true left, unions (in private, none of my true blue acquaintances favor unions), lions tigers and bears (although the owners of sports teams with those names are not likely disappointed,indeed, the two main candidates will be fine with the oligarchs no matter who wins…) Parrots will become the most popular pets for journalists, golden retrievers, golden doodles, and portugese water dogs will continue to eat better than the average plebe, and so on, and so forth…
Vote for harris or you’re a racist misogynist antisemite.
Who would you rather have get a call from a donor at 3am?
A curious thing happened this morning. I got a text asking me to contribute to Gavin Newsom, even though I am not a resident of California and he is not currently running for anything, afaik. I blocked & deleted it before I read it thoroughly, so I am not sure how they rationalized the money ask.
In WA I’ve received a couple FROM Newsom asking me to donate to Harris.
(Damn my naivete in donating to Sanders…)
Biden said he was a one term POTUS, then suddenly changed his mind when it came to sorting out the ticket for this election. This shows the DNC is in dissaray because they failed to sort out the mess that left them with Biden at the last election.
For all those touting Biden as the greatest POTUS ever, aside from this being a Trump marketing slogan, it is the people behind Biden, who was barely competent 4 years ago (when he fell up stairs when he still used the long aircraft staircase).
The DNC realized their error but the debate was not arranged by them, it was a joint thing and the mess he made gave room to replace the lame duck that they should not have backed in the first place.
The RNC and DNC are both broken, with the candidates being so bad that someone as bad as Harris looks likely to win because they are ‘none of the above’. Whoever runs US politics, it is not the electorate as proven by the headlines of how much money Harris has because US politics is all about being bought by corporations.
Harris will still back wars, destroy medicare, the housing market for the poor, workers rights just as Biden did. Biden talks about his deals for the auto workers but with the number of layoffs, this is another lie.
How is the semiconductor market doing? Another scam, with some of the world’s riches companies getting cash for setting up factories which are already proving too expensive and lacking staff