Yves here. I was initially put off by the term “cheapflation”‘ since I mistakenly assumed it was a diss of lower-income consumers, that inflation of lower-cost items hit them harder that inflation of goods generally hit the middle income and affluent. You’d expect something like this pattern to hold generally, since the poor spend more, often all, of their income on essentials. And in the recent inflation, in the US, food prices rose markedly and during the period right after the US imposed shock and awe sanctions on Russia, energy prices, particularly gas, also rose markedly. I’m not sure about food prices in the UK and EU, but as Conor Gallagher pointed out, no less than Mario Draghi pointed out in his 400 “revive the EU” scheme that higher energy price were continuing to afflict the union. In other words, energy prices have not fallen markedly from their 2022-2023 highs, unlike in the US.
But this post has a far more important finding. It turns out big companies engaged in predatory behavior towards lower-income consumers by increasing prices of less costly goods by a higher percentage than more expensive offerings.
I do not buy the argument made in the post that these increases were substantially the result of cost increases. Yours truly is old enough to remember the big inflation of the 1970s and early 1980s. Then, many companies accepted lower profit levels and did not pass on the full increases in their costs to consumers. Some of this was admittedly due to competitive concerns, with much less concentration in many sections of the economy. With corporate profits at a nosebleed percentage of GDP, this “we must preserve our sanctified returns” is offensive. A similar line of justification that winds up at the same “Profits uber alles” end point would be the claim that companies expected consumers of pricier items to shift their purchases down market.
This is a classic example of Lenin’s dictum “The capitalists will sell us the rope with which we will hang them.” Better off voters and the Democratic party elites in particular seem baffled about (which is a polite cover for unsympathetic to) the continuing complaints of price pain from lower and middle income consumers. Those same members of the affluenza, via shareholdings and sometimes directly by working for the perps, benefit from corporations using every mechanism they can find to increase profits. The fact that those measures hit the comparatively or actually disadvantaged hard is of little mind. Then they whinge about populism and depict it as a threat to their democracy, as opposed to their wealth.
By Tao Chen PhD candidate in Economics University College London, Peter Levell, Associate Director Institute for Fiscal Studies (IFS), and Martin O’Connell, Research Fellow Institute for Fiscal Studies (IFS); Assistant Professor University of Wisconsin – Madison. Originally published at VoxEU
Inflation rates soared over the period 2021-2023, driving down households’ real incomes in the UK and other countries. This column uses detailed data on price and spending patterns for groceries to assess the relative impacts of inflation across rich and poor households. Significant differences in grocery price inflation experienced by rich and poor households only emerge once the most disaggregated product definitions are used. Price increases were disproportionately large for individual varieties of products that were initially cheaper (‘cheapflation’), driving up inflation rates for worse-off households.
Inflation rates rocketed across the world in 2021-2023, reaching rates unprecedented for more than 30 years. This inflation did not affect households equally. Food and fuel prices rose particularly quickly, disproportionately eroding the purchasing power of lower-income households, as various analyses have shown (Palotti et al. 2024). However, these analyses capture the effects of differences in households’ spending across product categories (such as bread, pasta, etc.), but miss the impacts of differential price changes across individual products within these categories (such as premium or discount varieties of bread).
In a recent paper (Chen et al. 2024), we use detailed household scanner data covering fast-moving goods in the UK for 2021-2023. This allows us to measure the changing cost of household consumption baskets that differ in terms of the individual items they buy. We discuss trends in inflation inequality and document the importance of cheapflation – faster price increases for goods at the lower end of the quality ladder – for understanding inflation inequality over this period. As we show, cheapflation was widespread and key to understanding the distributional impacts of the high inflation rates households experienced.
Inflation and Inflation Inequality
We start by showing that not only the level of overall inflation, but also the inequality in inflation rates across different households, was unprecedented in recent years. In the nine quarters from 2021Q3, average cumulative inflation for products in our data was 26.6%. To capture inequality in inflation, we bin households into percentiles based on their equivalised annual expenditure. Households in the top decile of the expenditure distribution experienced inflation that was 7.7 percentage points lower than those in the bottom decile. None of the nine quarter periods over 2012-2020 show comparable differences between the inflation rates of rich and poor, as Figure 1 shows.
Figure 1 Household-level inflation inequality
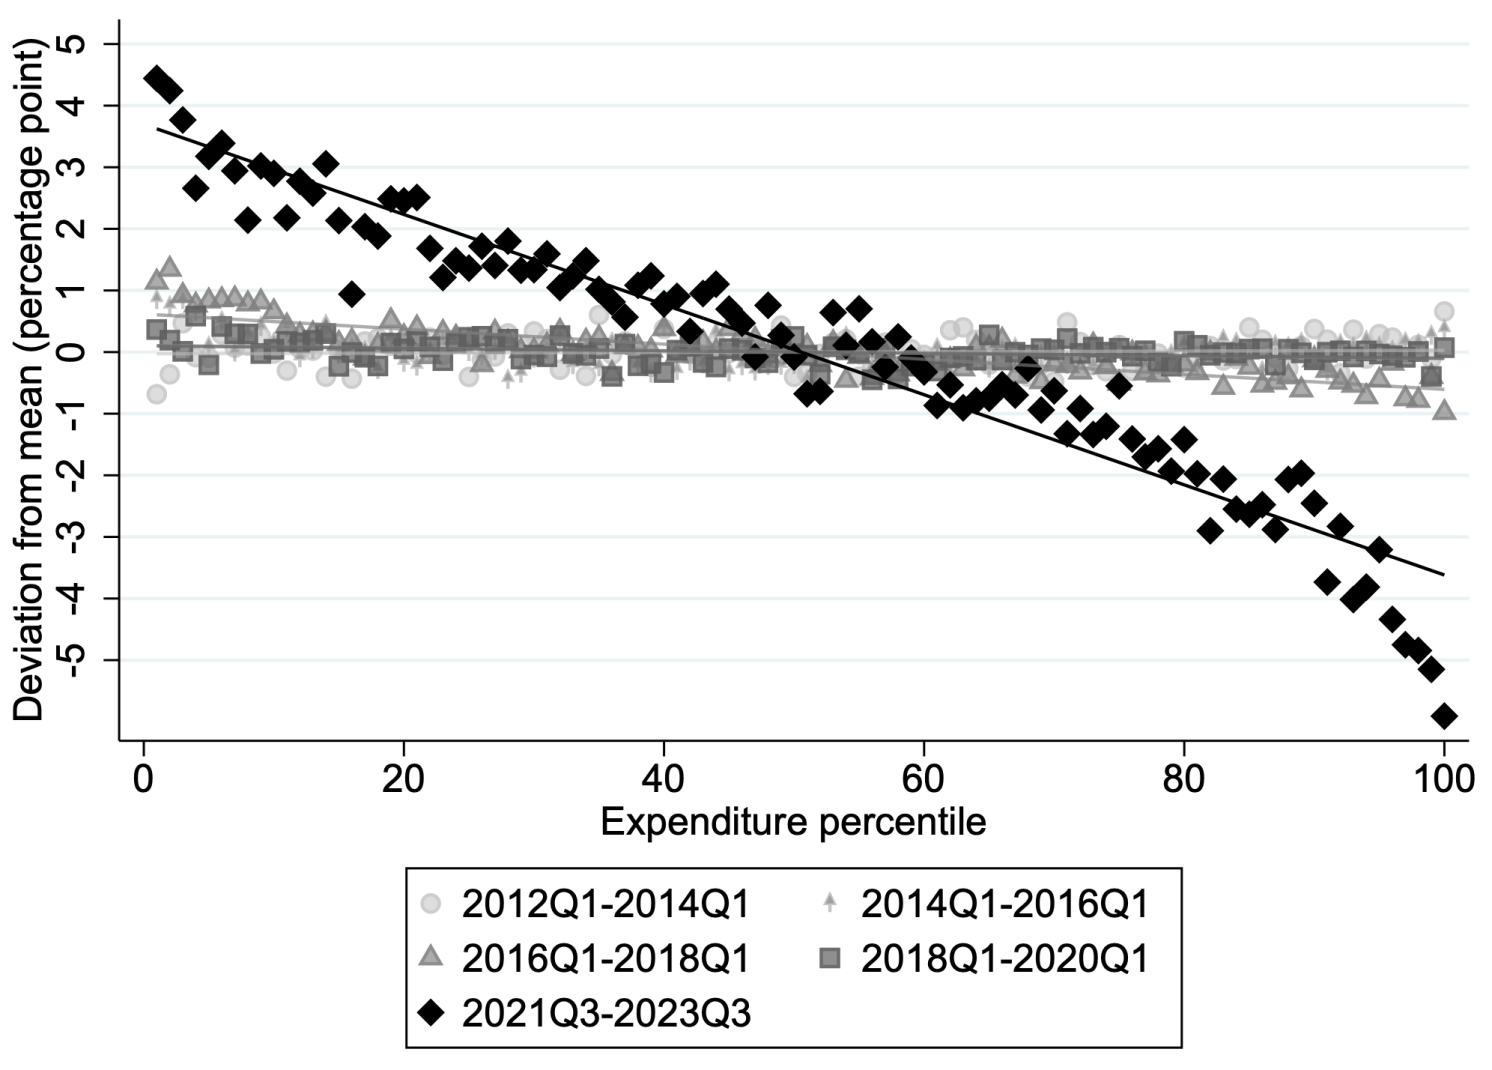
Notes: Authors’ calculations using Kantar’s Take Home panel (2012-2023). The figure plots the relationship between 9th quarter cumulative inflation and percentile of the expenditure distribution a household belongs to; there is a marker for each percentile and a line of best fit. We allocate households to expenditure percentiles based on their equivalised spending over the initial calendar year of the relevant nine quarter period. Cumulative inflation is computed using an annually chained Laspeyres index.
What Was Behind Inflation Inequality?
This inequality in inflation rates could be driven by variation in consumption baskets or in differences in the prices consumers pay for the same products. We show that while poorer households typically pay lower prices than better-off households for identical products, this difference was stable over 2021-2023. Therefore, the inflation inequality was driven by differences in consumption baskets. But was it variation in consumption baskets across broad product groups (e.g. alcohol vs. dairy), product categories (e.g. beer vs. wine), or across narrow products within product categories that was most important in driving inflation inequality?
Using a layered price index that allows us to decompose the contribution made to inflation inequality due to differences in spending shares at these three levels, we show that differences within product categories explain 55% of the inflation dispersion across households. Figure 2 shows how measures of inflation rates, and their dispersion across households and expenditure levels, change when we replace household-specific shares with average budget shares at different layers of aggregation. It shows that within category differences in spending patterns entirely account for the inflation gradient across the expenditure distribution.
Figure 2 Decomposing household inflation and inflation inequality with a layered index
Panel A Distribution
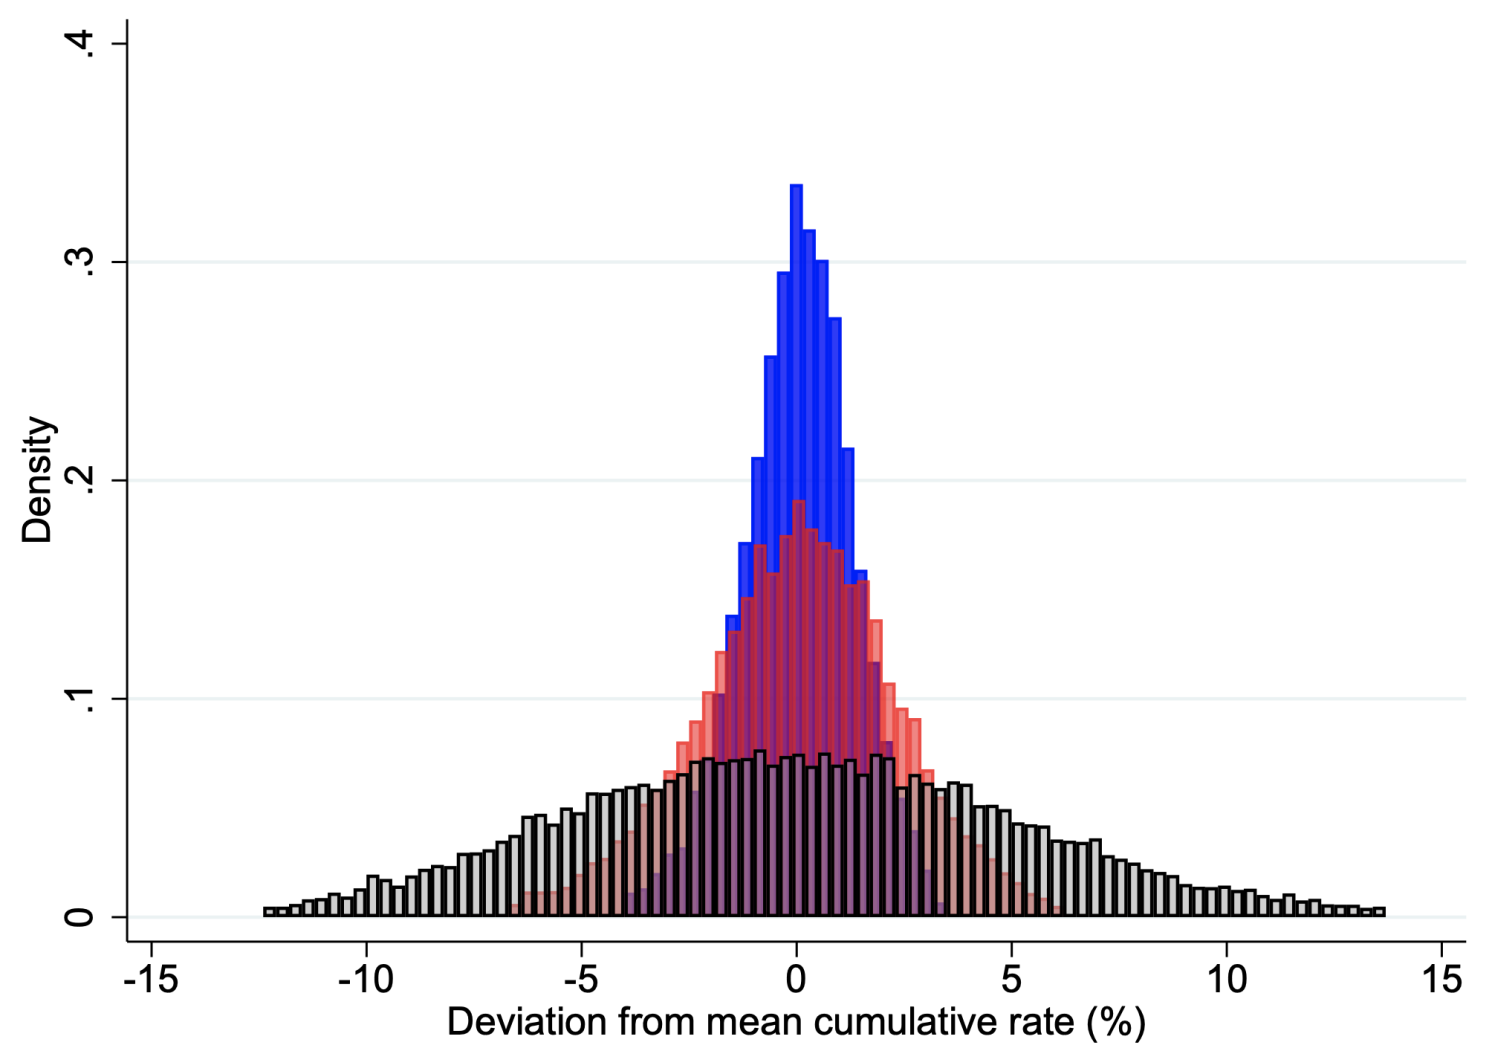
Panel B Inequality
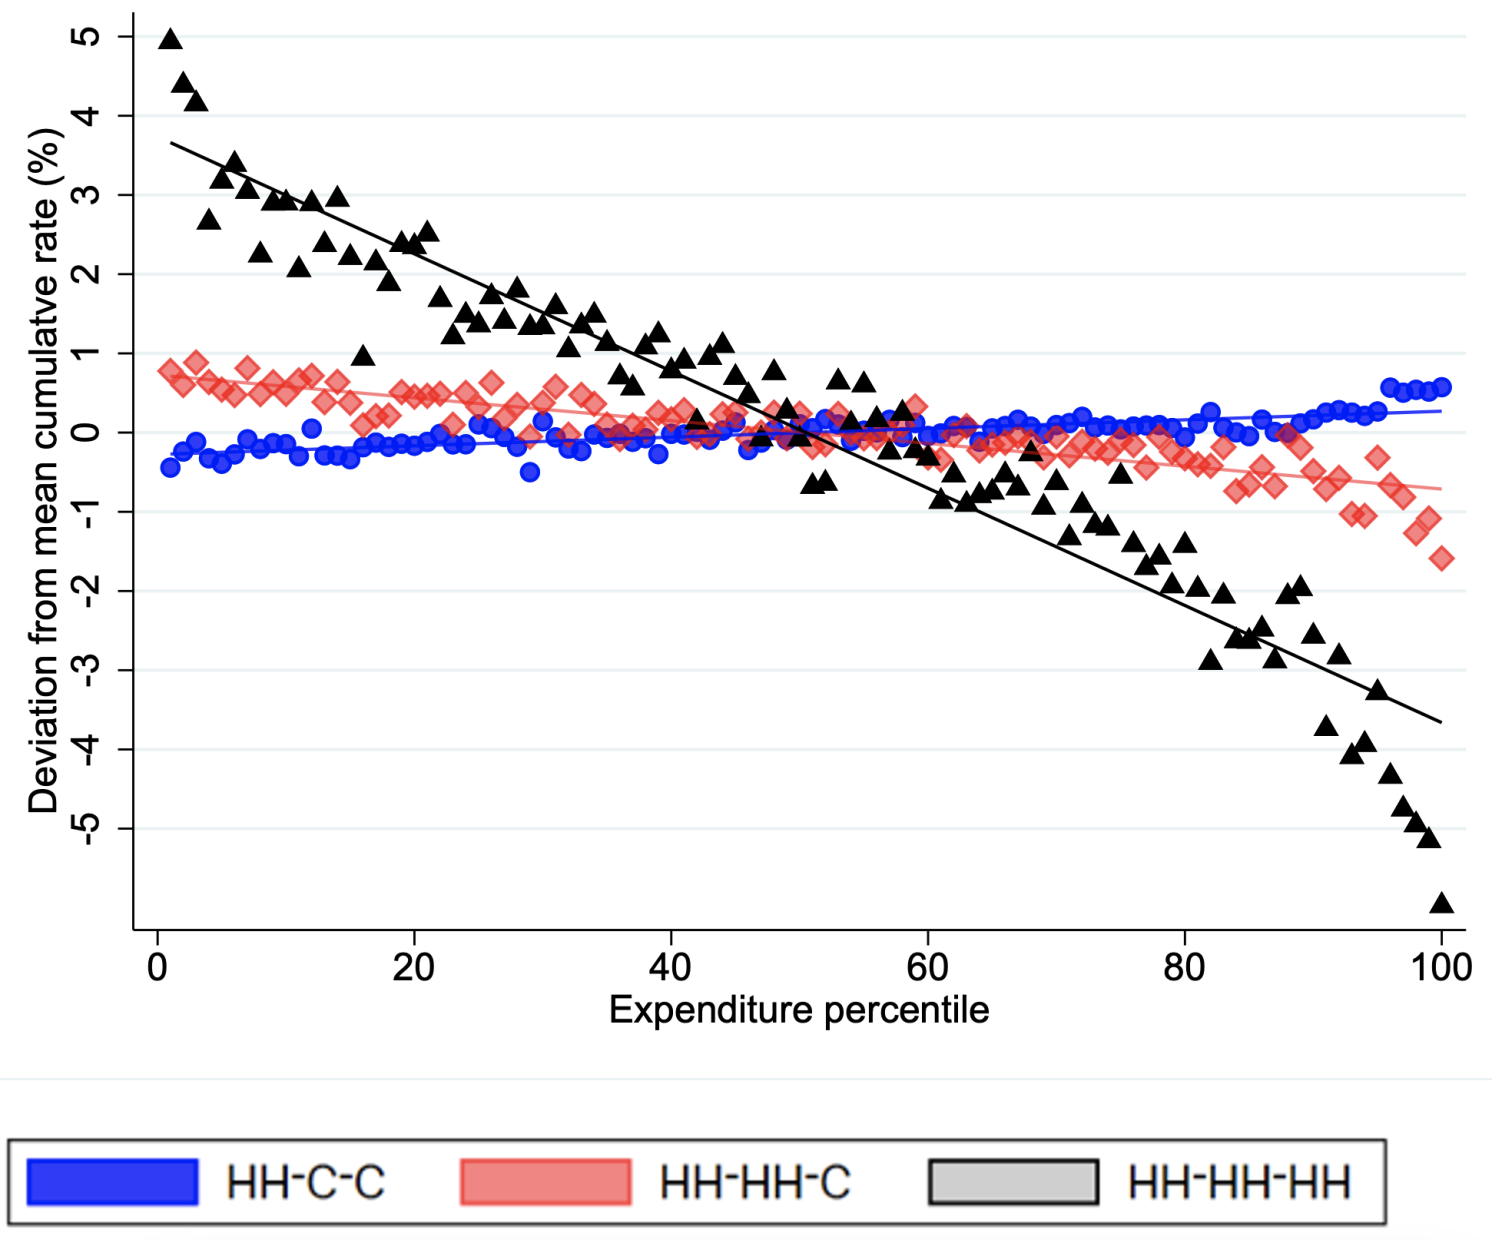
Notes: Authors’ calculations using Kantar’s Take Home panel (2021-2023). Panel (a) show a histogram of the distribution of cumulative inflation over 2021Q3-2023Q3 and panel (b) plots the relationship between cumulative inflation and percentile of the expenditure distribution a household belongs to; there is a marker for each percentile and a line of best fit. HH-C-C uses household specific segment shares and average within-segment shares, HH-HH-C uses household-specific segment and category shares and average within-category shares. HH-HH-HH uses household-specific shares at all levels. We allocate households to expenditure percentiles based on their equivalised spending in 2021. Cumulative inflation is computed using an annually chained Laspeyres index.
To better understand why within-product category variation in consumption baskets drives inflation inequality, we allocate products in each category into a ten-rung quality ladder according to their initial price. Proportional price growth is much greater for products on lower rungs of the quality ladder, a pattern recently dubbed ‘cheapflation’ (Cavallo and Kryvtsov 2024). Over 2021Q3-2023Q3, products on the bottom two rungs exhibit average price rises of 34%, whereas those on the top two rungs have average price rises of 18%.
Worse-off households are more exposed to price rises for lower-quality products, and so experienced higher inflation rates. Comparing the recent inflation spike to previous periods, we show that it is the pattern of price rises across the quality ladder (rather than changes in the make-up of consumption baskets across households of different resources) that is new and therefore key to explaining the recent inflation inequality.
Alternative Price Indices
We use a Laspeyres price index to document inflation inequality as this is the index number underlying the official Consumer Price Index (CPI) and it provides a transparent exact decomposition of inflation inequality using our layered index. However, this index correctly measures changes in the cost to a household of maintaining a fixed standard of living if households do not substitute across products between two comparison periods. Given the substantial relative price changes across the quality ladder, it is likely that households responded by reallocating their expenditure. The standard solution to substitution bias is to use a ‘superlative’ index that reflects changes in households’ budget shares in response to relative price changes. A superlative Törnqvist index suggests substitution responses acted to lower cost-of-living increases by 1.6 percentage points on average, and by 2.6 percentage points for households in the bottom decile of the expenditure distribution. In other words, it suggests that substitution effects acted to mitigate, but not overturn, inflation inequality. We also show that using a Feenstra (1994) correction for bias arising from product entry and exit has little impact on the size of the inflation gradient.
Superlative indices implicitly assume that changes in households spending patterns reflect their responses to relativeprice changes and not changes in households’ real incomes. We find that households’ spending shares on initially cheaper varieties of goods rose over this period, even though these goods saw faster price rises. Did this behaviour reflect limited substitution effects in response to price changes, or income effects? In the latter case, indices such as the Törnqvist might exaggerate reductions in the cost of maintaining the pre-inflationary shock standard-of-living.
A recent literature (Baqaee et al. 2024, Jaravel and Lashkari 2024) has developed methods for approximating a cost-of-living index that accounts for households reallocating their spending due to income effects. We use the method developed by Jaravel and Lashkari (2024) to correct for this ‘non-homotheticity bias’.
We find non-homotheticity bias in the Törnqvist index, when used as a measure of changes in the cost of maintaining living standards at their original 2021Q3 level, ranges from zero for the poorest households, to over one percentage point for the richest. The gradient in non-homotheticity bias partially counteracts the gradient in substitution effects suggested by the unadjusted Törnqvist index. In other words, for better-off households the Törnqvist index understates the extent of substitution effects, as it is contaminated by these households switching to products with high price growth through an income effect. Overall, after accounting for substitution effects and preference non-homotheticities, we find that households in the top decile of the expenditure distribution experienced cost of-living increases that were 7.2 percentage points lower than those in the bottom decile.
What Caused ‘Cheapflation’?
Inflation and cost-of-living inequality were driven by cheaper products exhibiting relatively high price growth. As a central driver of these price increases was cost increases (Competition and Markets Authority 2023), differential pass-through of cost shocks is likely to have played a key role in driving cheapflation.
The 2021-2023 inflationary episode is the result of a complex set of shocks to commodity and energy prices, labour markets, and global supply chains. Therefore, to assess whether marginal cost shocks differentially pass-through to prices, we use an earlier cost shock: the sterling exchange rate depreciation that occurred around the UK’s vote to leave the EU. This is likely to have had a similar proportional impact on the marginal costs of supplying euro area imports of fresh products, with no direct effect on the costs of similar domestic products. We show that in the year following the 20% depreciation in the £-€ exchange rate, the price of fresh EU products (such as fruit, vegetables, and meat) in the lower half of the pre-shock price distribution rose by around seven percentage points relative to both domestic and higher-priced EU produce. This provides the first evidence of Brexit driving relative price rises for cheaper products, and points to a pattern of higher proportional pass-through to lower quality products likely being an important contributor to cheapflation and inflation inequality.
A possible reason for differences in pass-through is that firms’ mark-ups for more expensive and higher quality products are more responsive to cost shocks (e.g. because larger margins on these products mean that suppliers have more cushion to absorb cost shocks before increasing prices). Alvarez et al (2024) and Sangani (2023) both find that pass-through across the quality ladder does not differ in terms of levels, implying greater proportional price changes for initially cheaper products.
Conclusions
Estimates of inflation inequality typically draw on household budget surveys, with spending aggregated into a few dozen product categories (e.g. Office for National Statistics 2022). Our findings suggest that even these relatively detailed surveys can significantly mismeasure the degree of inflation inequality. A danger is that such measures appear likely to understate the inflation rates experienced by lower-income households at times when price increases are particularly rapid, and when demand for such estimates is most pressing.
See original post for references


Notice what has happened to the cost of credit card borrowing, on which lower income households are more dependent:
https://fred.stlouisfed.org/graph/?g=1nqwy
January 15, 2018
Interest Rates on Credit Card Plans minus 5-Year Treasury, 2007-2024
https://fred.stlouisfed.org/graph/?g=1nqNm
January 15, 2018
Interest Rates on Credit Card Plans minus 5-Year Treasury, 2000-2024
Should “working for the perts …”
be “working for the perps …” ?
Fixing, thanks!
Price difference reduction makes the more expensive items seem affordable, I suspect the margins on the expensive items are higher. Profit motivated.
Austerity creates dependency and passivity, to an extent. So does poor health.
Given the history of Revolts etc, it is always adviseable to cow the peasants and remove knowledge of how to make weapons etc.
Ignorance is Strength!
An excellent analysis demonstrating how inflation is always and everywhere a distributional phenomenon. Also note how this undermines the narrative favoured by the Biden Administration about how wages having risen the most at the bottom of the income distribution somehow reflected a significant reduction in inequality — family blog it did in real consumption terms, and that’s before looking at how paltry whatever gains were made against the prevailing negative trend over the past 40 years.
“Best economy evah!” and “vibecession” my erse …
Not to discount the effects of greed, it seems to me that the higher shipping volume of lower-priced products might account for much of the variance, putting the pain back on a failure of governments’ mitigation.
Joe Biden still owes me $600.
Your being pushed into purchases where “quality per dollar” hit diminishing returns awhile ago. This is what really eats at you when you purchase low end goods for high end prices.
In this scenario if it’s not a consumable (like food and some home good products) then I need “buy it for life” level of quality or I am not interested. But that means I wait a lot longer to buy things.
It would have been nice if this study had shone a spotlight on the fundamental unfairness of the volume discount given to people with room in their budgets and homes to ‘stock up’. There is literally a tax on the poor, solos, and those just wishing to buy one of something, or a small box of it. There is a soccer-mom discount for buying in ridiculous bulk. Where years ago the buy-3 discount might have been 10 or maybe 20%, now it can be as much as 80%. While the homeless or elderly person buying one pack pays almost double. Why? So people can be coerced to spend more on their total receipt for the day, so the executive suite can boast higher revenues due to their brilliant managing.
This system was all ingrained in us as fair ‘to help families’, but, at this point in time when we could all do to cut out waste of food and waste in transportation costs, we need some policy leaders to say ‘you know, more is not better or more virtuous, and those who buy small deserve a break’.
That 2 or 3 discount to me is a tax on seniors
According to my understanding of Marx. Unhindered capitalism necessarily leads to growing inequality and concentration of wealth at the top. It’s not a bug it’s a systemic feature. As well as the apparition of an oligarch class of course.
It’s manifestation is easy enough to understand when you look at what has happened in just the last few years.
Inflation was higher on lower end food than for higher end food.
Inflation was higher for lower end housing than for higher end housing.
Income increased proportionately faster for the rich than the lower classes and the poor.
Total wealth increases went almost exclusively to the already rich.
The end result is more poverty and more homelessness.
The cloak of censorship and propaganda makes it more difficult to understand but the results are out there for everyone to see.
Meanwhile, a lot of people weirdly think we are moving towards communism or are all in on the emotionally divisive woke vs anti-woke bandwagon so our future trajectory looks like more of the same.
Perhaps differences in the price increases on various goods are related to how particular price increases affect particular segments of the Populace and Elites, and the relative differences in political power between the segments of the Populace and the Elites. Perhaps similar considerations explain the peculiar inability of inflation measures to measure inflation.
I recall many years ago an econ teacher saying that in the retail grocery business, net margins were thin (single digit), but volume high, so profits could be made. Econ textbooks tell us about “perfect competition” leads to the most efficient market possible and all that.
Anecdotally, I see basic STAPLE items in grocery stores priced with what would appear to be double-digit margins. If one looks at commodity and factor prices, the continued high food prices do not appear to be justified at all. Over the years, increased market consolidation, and monopolization of logistic/distribution channels seem to have given the players huge market power and they are now blatantly colluding and price fixing. I recall some studies on this, but I don’t have them to hand at the moment, but even a quick scan of grocery oligopolies and the prices of staples like bread, fruit and veg, etc. are disproportionately high. This could be seen as part of the ‘cheapflation’ extortion going on.
If you want food, energy, health care, housing (the most basic necessities of life) you will get gouged and extorted for it. Don’t like it? Feel fortunate if you can afford to pay the extortion, many can not.
Olive oil at my food CoOp just went up 21% after a previous 8% increase. Yikes!
Big issues with oil crops in Italy, Spain, Greece, etc… However, I found artichoke jars still holding their old prices and a 1.8L jar for 15 CAD is awsome.
We have locally-produced olive oil here in California, which has had no such problems. but like everything from CA, it is way overpriced. I can get this brand a bit cheaper than the list price of 34.99 per liter at local markets, but it is still way too expensive. https://www.californiaoliveranch.com/products/100-california-everyday/41079566139576
Then there is the rampant fraud of diluted oils from Europe that keeps getting worse. It looks like the Cal stuff is pure, but you have pay nearly 3x the going rate for it.
https://www.theguardian.com/world/article/2024/jul/29/olive-oil-fraud-mislabelling-cases-record-high-eu
What really gets me is the price of a decent loaf of bread around here, it’s enough to make folks daydream of guillotines .
https://fred.stlouisfed.org/graph/?g=1hFMQ
January 30, 2020
Global Prices for Olive and Soybean Oil, 2020-2024
(Indexed to 2020)
The most effective price signals in the food business come from the financial market, not from the grocery product market, just like in the US airliner business. There is a structure in place that amplifies one signal and mutes the other (until the planes start crashing).
$8.50 for a box of All-Bran now where I live. The only brands of cereal they can’t keep in stock where I shop are the cheapest ones — they have trouble moving the $7.50 per box virtue-signaller flakes. My wheat farmer relatives are getting good prices now, but nothing that would drive that kind of increase. My cow/calf rancher friends are facing low prices. Somebody is making bank, somewhere.
At some point grocers stopped making enough money to pay an owner’s salary or dividends, and chose to make enough money to add new stores constantly, become big chains, then buy out other chains. The price you pay for an item at Kroger is to cover cost of operations, plus profit, plus the cost of buying another large chain, Albertsons. Smaller grocers could win that game except they are at a disadvantage with suppliers. So, everybody charges more than would be necessary in a marketplace that did not demand constant growth and buyouts.
this is the results of the elimination of internal competition, by driving out your competitor with cheap chinese goods and monopolization’s.
and of course long expensive supply chains, that allows for all to gouge along the way. simply the end results of crank economics peddled by the chicago/austrian schools.
I’ve noticed that foods that used to be relatively cheap no longer seem so, like eggs, oatmeal, canned soup and bread.
I wonder what the sales volume is for the different market segments. Are the sellers marking up where the volume is the biggest and steadiest? If they raise prices too much higher up people will just substitute down?
Most of those higher up are also getting squeezed; they just have more cushion. Some have so much cushion that these price changes are immaterial.
Are we still looking for clues (a type of intellectual and academic osteomancy) in those noble lies that are the foundation for the capitalist tragedy and farce? For example,
“Each year, more than $400 billion worth of food is wasted in America. Today, food loss and waste is treated as a tax deduction for grocery stores because the waste cuts into their profits. Meanwhile, whatever inefficiencies plague the system end up being paid for by shoppers, according to James McCann, the former CEO of grocery chains Tesco, Carrefour and Ahold USA. He says: “It’s billed into the price the consumer pays.””
https://www.forbes.com/sites/chloesorvino/2022/07/14/food-waste-costs-us-taxpayers-billions-of-dollars-a-year/?sh=39ba6a8442ea
Assuming that the case is one where higher prices lead to more foodstuffs sitting on shelves due to unaffordability. Once the expiry date arrives those foodstuffs will be dumped, as noted for the reasons stated above. If the tax deduction does not fully pay for the dumped product, it is assumed that higher prices will make up the difference; thereby, both satisfying the shareholders and the feedback loop itself.
Lastly, everyone is constantly reminded that, “All is for the best, in the best of all possible worlds.” Because after all, “The shelves at Moscow supermarkets are full of fruit and vegetables, cheese and meat. But many of the shoppers look at the selection with dismay as inflation makes their wallets feel empty.” Only in Moscow you say? Thank the household gods we are not in that situation!!??