This is Naked Capitalism fundraising week. 901 donors have already invested in our efforts to combat corruption and predatory conduct, particularly in the financial realm. Please join us and participate via our donation page, which shows how to give via check, credit card, debit card, PayPal, Clover, or Wise. Read about why we’re doing this fundraiser, what we’ve accomplished in the last year, and our current goal, karōshi prevention.
Yves here. This post discusses the prediction market reactions to the Harris-Trump debate and the ability to manipulate these markets. Yours truly needs to point out that even though these markets intend to be Keynesian beauty contests, as in participants try to guess who the popular winner is, as opposed to making their own choice. However, prediction markets have scored some major fails. The UK allows betting on election events, which serve in terms of scale as an even bigger prediction market relative to underlying vote counts that either prediction market examined below. On the Brexit vote, the UK touts had Brexit losing by four points. In fact, it won by two. It turns out these bettors were not adequately able to identify with general public sentiment, as opposed to their own. It turns out the number of wagers in favor of Brexit were considerably larger than the ones against, but the anti-Brexit speculators placed bets that IIRC were three times as large as bets that Brexit would win. The propensity to vote from Remain correlated with class.
By Rajiv Sethi, Professor of Economics, Barnard College, Columbia University &; External Professor, Santa Fe Institute. Originally published at his site
The first (and possibly last) debate between the two major party nominees for president of the United States is in the books.
It’s too early to know exactly how the debate will affect polling averages and the various statistical models that rely on them. But movements in prediction markets give us a glimpse of what might be on the horizon.
The figure below shows prices for the Harris contract on PredictIt and Polymarket over a twenty-four hour period that encompasses the debate, adjusted to allow for their interpretation as probabilities and to facilitate comparison with statistical models.1
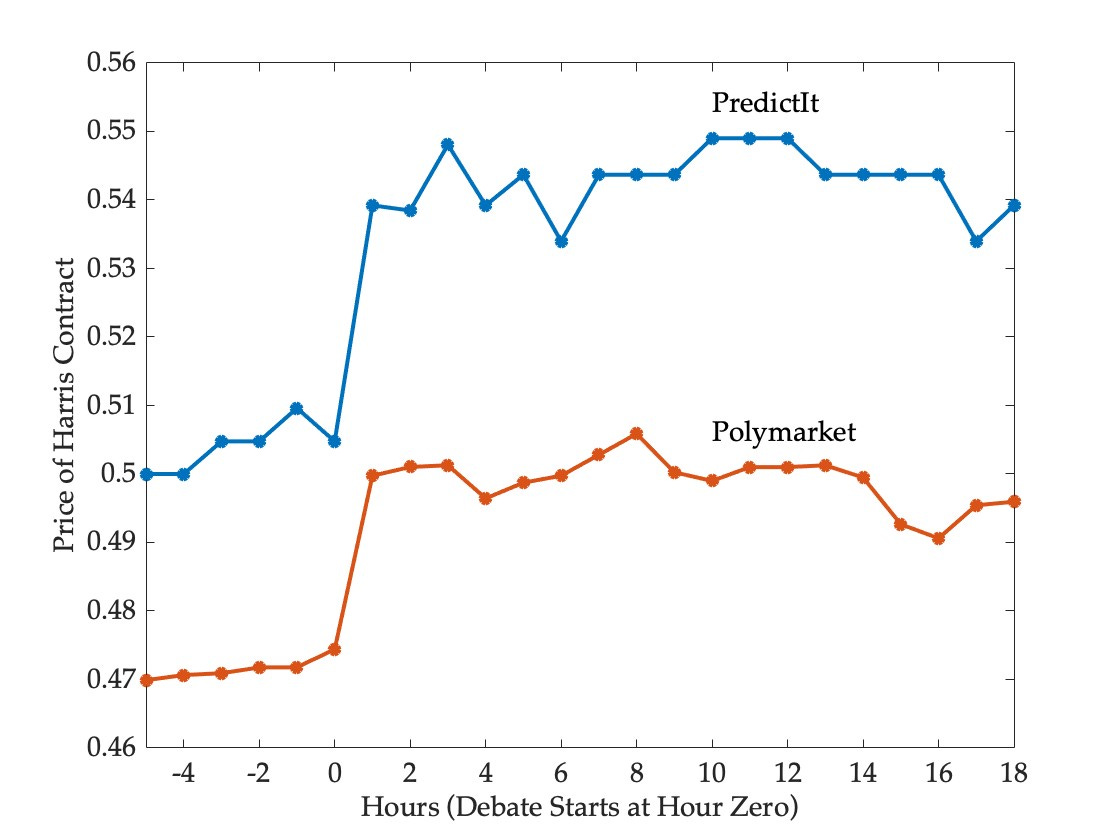
Five hours before the debate, the markets disagreed on the outcome of the election, with PredictIt seeing the race as a coin flip and Polymarket giving Trump the edge. Following the debate the markets continue to disagree, but now Polymarket sees the race as evenly poised, while PredictIt gives Harris the edge.
Despite these disagreements, the two markets responded in very similar fashion to the debate—they moved in the same direction to roughly the same degree. One hour into the debate, the likelihood of a Harris victory had risen from 50 to 54 on PredictIt and from 47 to 50 on Polymarket. Prices fluctuated around these higher levels thereafter.
Statistical models such as those published by FiveThirtyEight, Silver Bulletin, and the Economist cannot respond to such events instantaneously—it will take several days for the effect of the debate (if any) to make itself felt in horse-race polls, and the models will respond when the polls do.
This is one advantage of markets as forecasting mechanisms—they can take into account novel and qualitative sources of information without delay, and continue to make coherent predictions even when models lose continuity and reliability in the face of unprecedented events.
But markets have drawbacks too—they can be subject to overreaction and manipulation. So I will be looking to see how model forecasts evolve over the coming days. There will be confounding factors, of course, so this is not a clean experiment. But what markets are predicting is an increased likelihood of victory by about three to four percentage points for Harris once the models have adjusted to the effects of the debate.
While the markets responded to the debate in similar fashion, the disagreement between them regarding the election outcome has not narrowed. This rasies the question of how such disagreement can be sustained in the face of financial incentives. Couldn’t traders bet against Trump on Polymarket and against Harris on PredictIt, locking in a certain gain of about four percent over two months, or more than twenty-six percent at an annualized rate? And wouldn’t the pursuit of such arbitrage opportunities bring prices across markets into alignment?
There are several obstacles to executing such a strategy. PredictIt is restricted to verified residents of the US who fund accounts with cash, while trading on Polymarket is crypto-based and the exchange does not accept cash deposits from US residents. This leads to market segmentation and limits cross-market arbitrage. In addition, PredictIt has a limit of $850 on position size in any given contract, as well as a punishing fee structure.
This leads to a natural question: which market should one take more seriously as a forecasting mechanism? Polymarket has no limits on position size and enjoys much greater trading volume, with almost 900 billion dollars having been wagered in the presidential winner market to date (compared with about 37 million in the corresponding market on PredictIt). But larger volume does not always mean better forecasting, and position limits can improve forecasting accuracy by ensuring that no trader is large relative to the market as a whole.
While arbitrage places limits on the extent to which markets can disagree, there is no such constraint on statistical models. Here the disagreement is substantially greater—the probability of a Trump victory ranges from 45 percent on FiveThirtyEight to 49 percent on the Economist and 62 percent on Silver Bulletin.
Why the striking difference across models that use basically the same ingredients? One reason is a questionable “convention bounce adjustment” in the Silver Bulletin model, without which its disagreement with FiveThirtyEight would be negligible.
But there also seem to be some deep differences in the underlying correlation structure in these models that I find extremely puzzling. For example, according to the Silver Bulletin model, Trump is more likely to win New Hampshire (30 percent) than Harris is to win Arizona (23 percent). The other two models rank these two states very differently, with a Harris victory in Arizona being significantly more likely than a a Trump victory in New Hampshire. Convention bounce adjustments aside, the correlation structure across states in the Silver Bulletin model just doesn’t seem plausible to me.
In any case, once the election is over, we can evaluate the forecasting performance of the various models and markets based on a profitability test of predictive accuracy. Our analysis of this is already underway, and I look forward to reporting the results in due course.
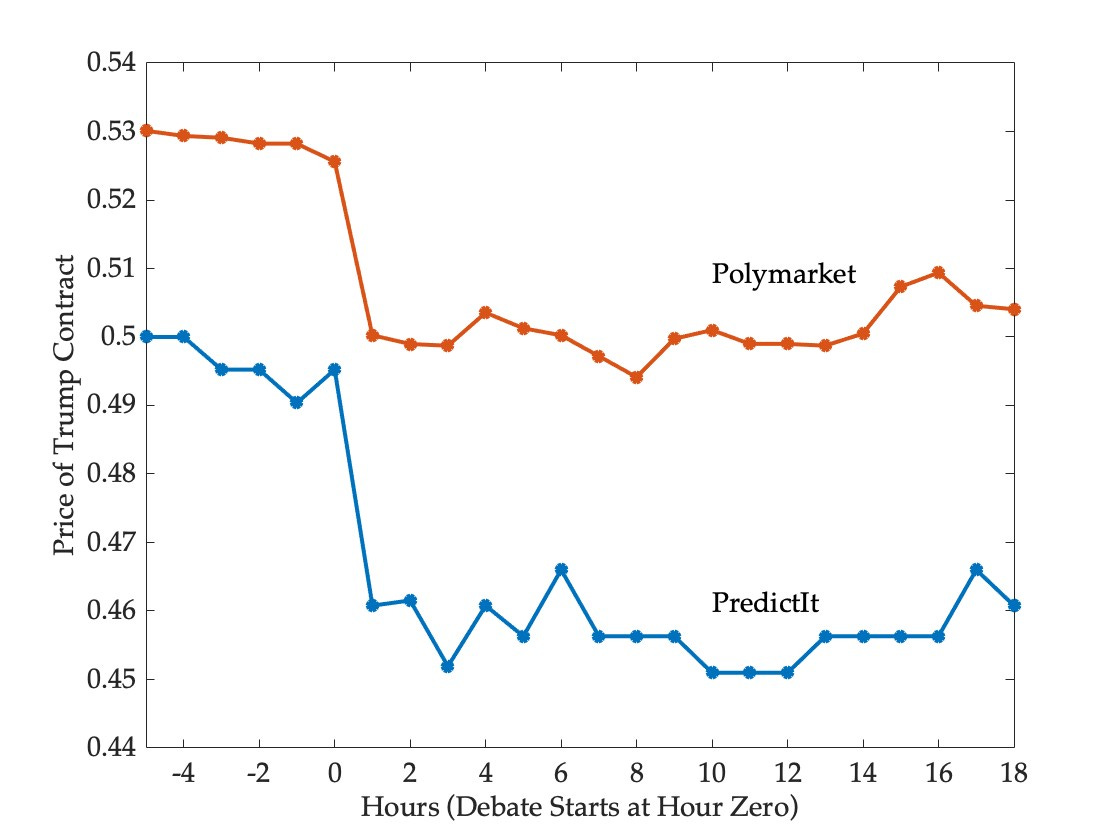
1 The adjustment is necessary because the prices of the two contracts don’t always sum to one, on account of fees and the fact that the they are traded independently. To convert prices into probabilities, one can divide the price of each contract by the sum of the prices of the two contracts. For example, at the end of the period shown, Harris and Trump contracts were trading at 55 cents and 47 cents respectively on Predictit. This translates to probabilities of 54 and 46 percent. The adjusted prices of the Trump contracts are (by construction) a mirror image of the Harris prices:


If I’m not mistaken, the amount wagered on Polymarket should read as 900 million rather than 900 billion.
Thank you, yes I have fixed on my Substack
This reminded me of checking the candidates favourability ratings, which is the core of my own eyeballing model. In the 2016 exit polls those that liked Clinton voted for Clinton, those that liked Trump voted for Trump, those that liked both were to small a group to measure how they voted, and those that disliked both broke for Trump. In these times favourability sets a floor, those that likes a candidate is unlikely to like the other, and thus in the end likely to vote for the one they like.
538 has graph’s on the favourability ratings.
Trump has 52% unfavourable and 43% favourable. 55-40 at a low point a year ago, so he is improving, but slowly.
Harris was at 53-36 when she became the candidate (and that is a level she has been at for two years), but is now 47-46. Almost liked! So the hype campaign has improved her favourability, even though she remains slightly more disliked then liked.
This gives Harris an edge in the popular vote, but with Trump’s structural advantages in the electoral college, it is a toss up.
Fewer people want to bet on politics than owned a telephone in 1936. So I don’t think betting sites are useful for predicting the outcome of a presidential election.
That is part of it, for sure.
But also in a tight election, with problems in polling (people not answering, pollsters double dipping with those that answers, push polls etc), how would anyone have superior knowledge in the first place? Unless you control the voting machines or something, and then there are probably better and less obvious investements you can make.