Yves here. Wolf’s scenario on inflation is interesting, but given the welter of data revisions and forecast surprises, it seems fair to question whether what official reports depict now is any more accurate than what they seemed to say a month ago. Reader input on local and industry conditions very much appreciated.
However, even if inflation gets worse (which becomes likely regardless of the trajectory of the US economy if oil prices rise markedly and stay high as a result of the Middle East conflicts escalating), at some point it seems destined to tip into stagflation. Higher interest rates dampen borrowing and the valuation of companies with longer-term and/or speculative payoffs, which means tech above all. That means lower investment. A second channel by which inflation dampens investment is that over a certain level (which historically seemed to be 6% to 7%), the meaning of financial statements starts to become questionable because different line items inflate at different rates, and those differences matter. When I was a kid, choices like whether to use LIFO or FIFO accounting for inventories matter.
That produced uncertainty as to whether reported cash flows were accurately depicting the health of the company (for instance, use of historical asset values for depreciation would understate ongoing capital investment needs). That uncertainty had the effect of increasing investor required returns, pushing down stock valuations generally.
These considerations skip over how inflation, particularly in essentials like food and fuel, are politically destabilizing.
So that translates into an economy running too hot eventually becomes self-correcting. But the result, again, may be stagflation as opposed to recession.
By Wolf Richter, editor at Wolf Street. Originally published at Wolf Street
When the Fed cut its policy rates on September 18, it looked at labor market data showing a sudden slowdown of job creation to weak levels, and it looked at decent consumer spending data, so-so income growth, and a very thin and plunging savings rate. And the trends looked lousy.
But starting 11 days after the Fed’s decision, the revisions and new data arrived. And the whole scenario changed.
So at a summary level, economic growth in three of the past four quarters, as revised, was substantially above the 10-year average of about 2.0% GDP growth adjusted for inflation:
- Q3 2023: +4.4%
- Q4 2023: +3.2%
- Q1 2024: +1.6%
- Q2 2024: +3.0%
The third quarter looks pretty good too: The Atlanta Fed’s GDPNow estimate for Q3 real GDP growth is currently 3.2%, of which consumer spending contributes 2.2 percentage points, and nonresidential fixed investment contributes 0.9 percentage points.
In terms of the hurricanes and tornados that have caused a lot of destruction and horror: Because worksites were closed temporarily, and people had trouble getting to work, there will be a temporary spike in weekly unemployment claims and an uptick in unemployment in the affected regions. But the US has been through the horrors of hurricanes and tornadoes many times. What follows quickly thereafter is the spending and investment boom from clean-up, replacement, and rebuilding, which are all contributors to employment and economic activity.
A Bunch of Massive Up-Revisions After the Fed Meeting.
Consumer income, the savings rate, spending, GNI, and GDP were revised up on September 27, so 11 days after the Fed’s rate-cut meeting.
The annual revisions of consumer income and the savings rate were huge this time, going back through 2022, and consumer spending was also revised up, but not as much.
These massive up-revisions of income and the savings rate resolved a mystery: Why consumers have held up so well. And they brought growth of GDP and GNI (Gross National Income) back in line by revising GDP growth up some and GNI growth up a lot.
The magnitude of the revisions was astonishing, and we speculated here the large-scale influx of legal and illegal migrants – estimated by the Congressional Budget Office at around 6 million total in 2022 and 2023, plus more in 2024 – was finally getting picked up in some of the data. A big part of them have joined the labor force, and many of them are working and making money, and spending money, thereby increasing the income and spending data.
Between July 2022 and July 2024, over these two years, personal income without transfer receipts (so without payments from the government to individuals, such as Social Security, VA benefits, unemployment insurance compensation, welfare, etc.) adjusted for inflation:
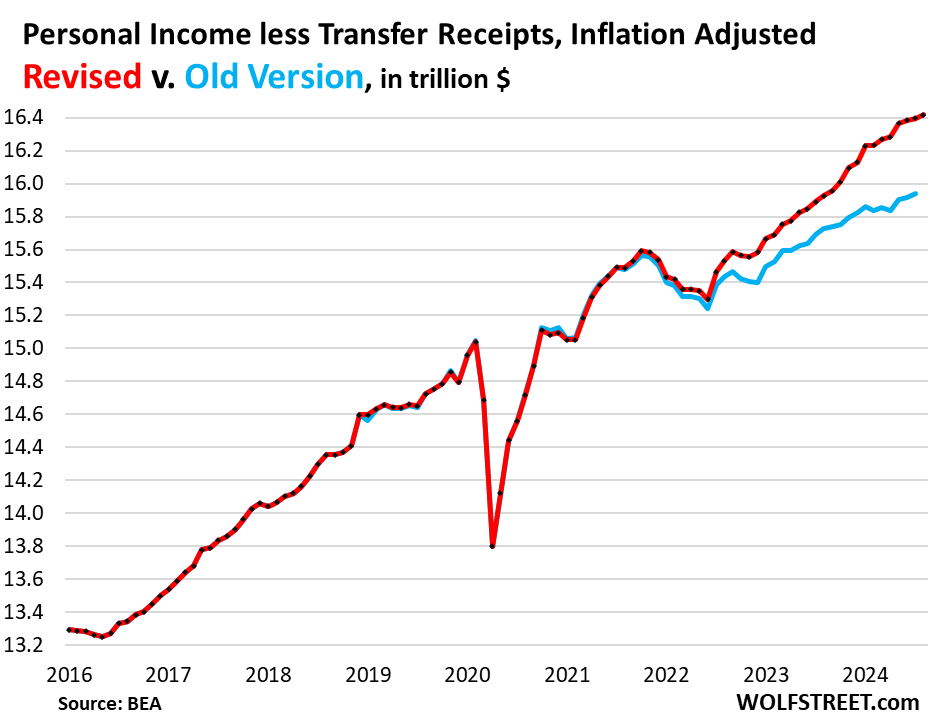
The revisions to the savings rate are important because they showed that consumers spent substantially less than they made going back through 2022, and saved the rest, which bodes well for future consumption.
Income was revised up massively, and spending was revised up but less, and so the savings rate – the percentage of the disposable income that consumers didn’t spend – was revised up in a stunning manner: The revised savings rate for July was 4.9%. The old version of the savings rate for July was just 2.9%.
We have seen in the ballooning cash accounts, such as CDs, money market funds, and T-bills, that households are not only flush with cash but kept adding to their cash holdings, and we used this continued ballooning of cash holdings as a better signal of the health of consumers than the anemic savings rate. Now the massive revisions of the savings rate going back two years confirmed this.
The nonfarm payroll data was revised up on October 4, so 16 days after the Fed meeting.
The primary reason cited by the Fed for the 50-basis-point cut was the sudden deterioration of the nonfarm payroll data: The three-month average of payroll jobs created had slowed dramatically in July and August in part due to downward revisions of prior data, and we pointed that out at the time, it was a disconcerting sight.
But with the strong September jobs report came the up-revisions of prior data that prompted this headline here: OK, Forget it, False Alarm, Labor Market Is Fine, Bad Stuff Last Month Was Revised Away, Wages Jumped. No More Rate Cuts Needed?
“Pandemic distortions and millions of migrants suddenly entering the labor market, who are hard to track, have wreaked havoc on data accuracy,” we said in the subtitle. There is nothing like data whiplash.
It also solved another mystery: The weak payrolls data for July and August didn’t match other employment data, which had been fairly good.

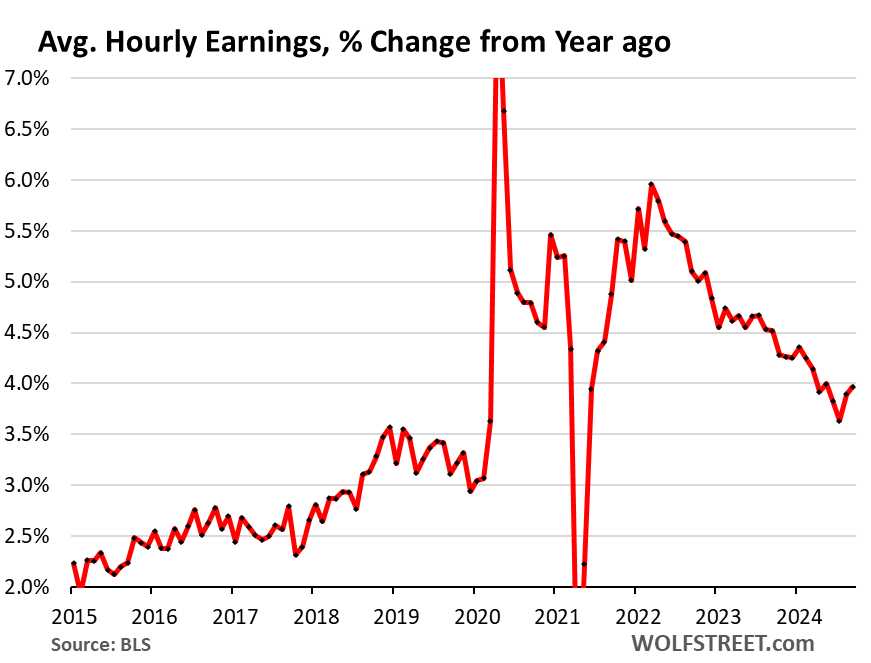
The increases in hourly earnings were also revised higher, with the revised three-month average income growth rising to 4.3% annualized.
The year-over-year increase rose to 4.0% for September, the second month in a row of year-over-year increases. Those two months combined increased the most for any two-month period since March 2022, and are well above the peaks of the 2017-2019 period.
“So in terms of inflation – and what the Fed has been worrying about – this accelerating wage growth is not going in the right direction anymore,” we said at the time.
And so Inflation Is No Longer Going in the Right Direction
Energy prices have plunged, and that has papered over the problems beyond energy.
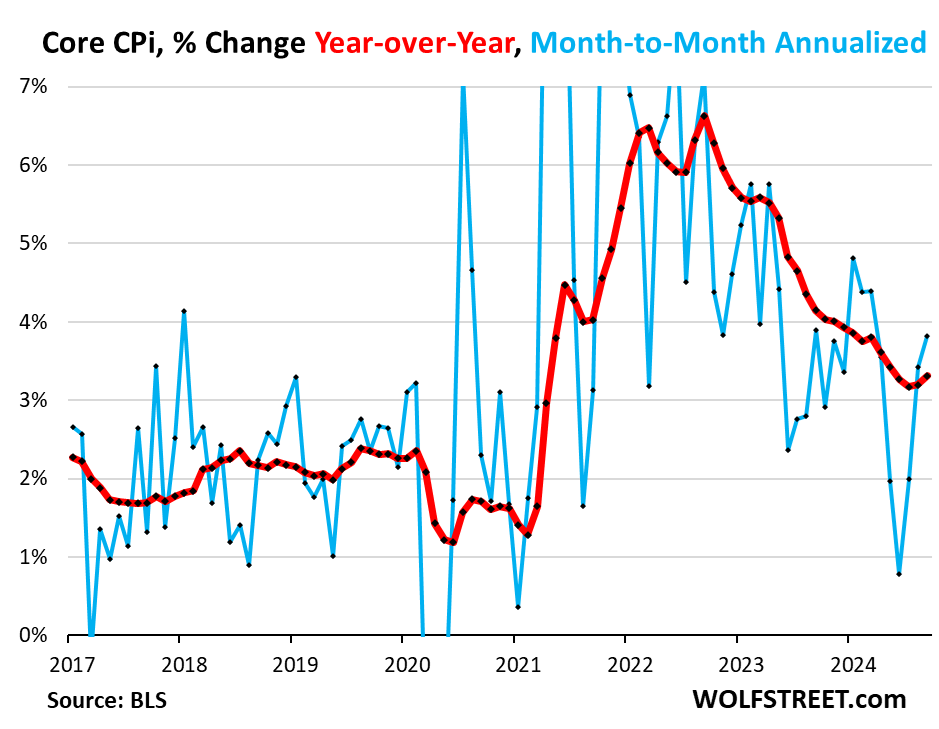
Core CPI, which excludes energy products and services and also food, accelerated for the third month in a row in September to +3.8% annualized (blue line), which caused the 12-month rate to accelerate to 3.3% (red line).
Inflation in services has turned out to be sticky. And then there are motor vehicles, where prices had been falling – plunging for used vehicles – which had been a big factor in pushing down core CPI since mid-2022. But they U-turned in September and headed higher (for details, see our “Beneath the Skin of CPI Inflation”).
This is not red-hot inflation like it was two years ago, it’s a lot lower than that, and the Fed has succeeded in bringing inflation down, but it’s re-accelerating inflation that’s still too high to begin with.
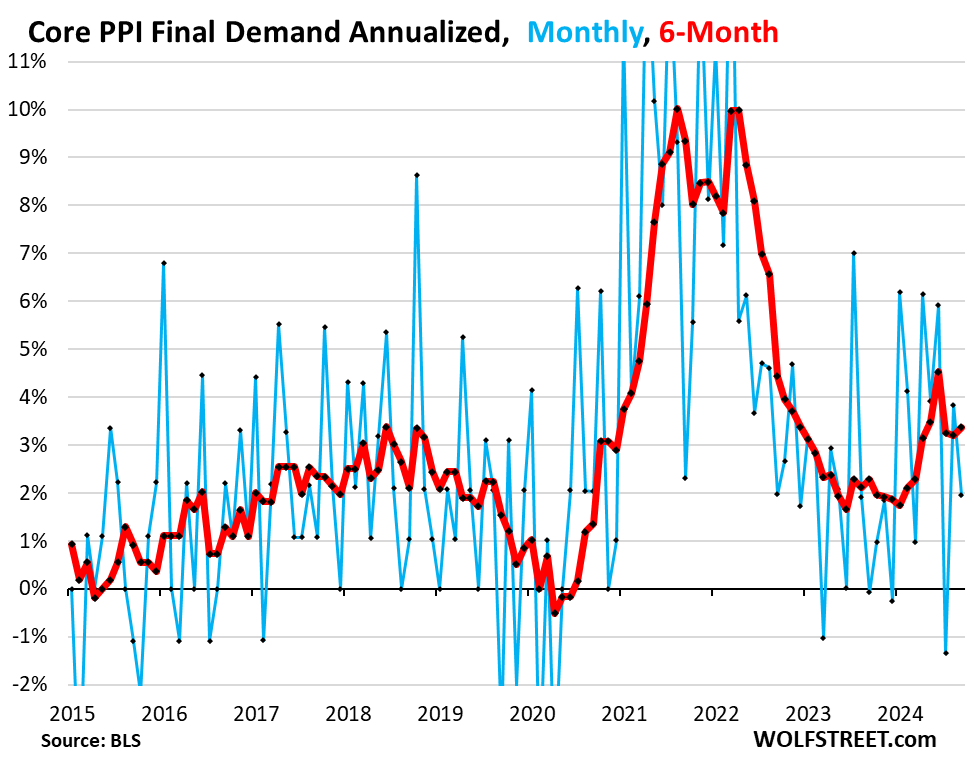
Inflation at the producer level – beyond the plunge in energy prices – has been going in the wrong direction all year, driven by accelerating inflation in services, after benign readings last year.
And on Friday, the core Producer Price Index was made a lot worse by big up-revisions of prior months, which caused the six-month average (red) to accelerate to +3.4% annualized for September. Last year, it had hovered nicely around the 2% line.
The Fed’s Policy Rates Are Still Well Above Inflation Rates
The Effective Federal Funds Rate (EFFR), which is targeted by the Fed’s policy rates, dropped to 4.83% after the rate cut, so that’s about 1.5 percentage points above the 12-month core CPI inflation rate. EFFR minus core CPI represents the “real” EFFR, adjusted to core CPI inflation.
The zero-line marks the point where the EFFR would equal core CPI. During the ZIRP era following the Financial Crisis, the real EFFR spent most of the time in negative territory. In 2021, as inflation exploded and the Fed was still at near 0% with its rates and doing $120 billion a month in QE, the real EFFR plunged historically deep into the negative. The Fed called this phenomenon “transitory,” and we called the Fed “the most reckless Fed ever” (google it, just for fun):
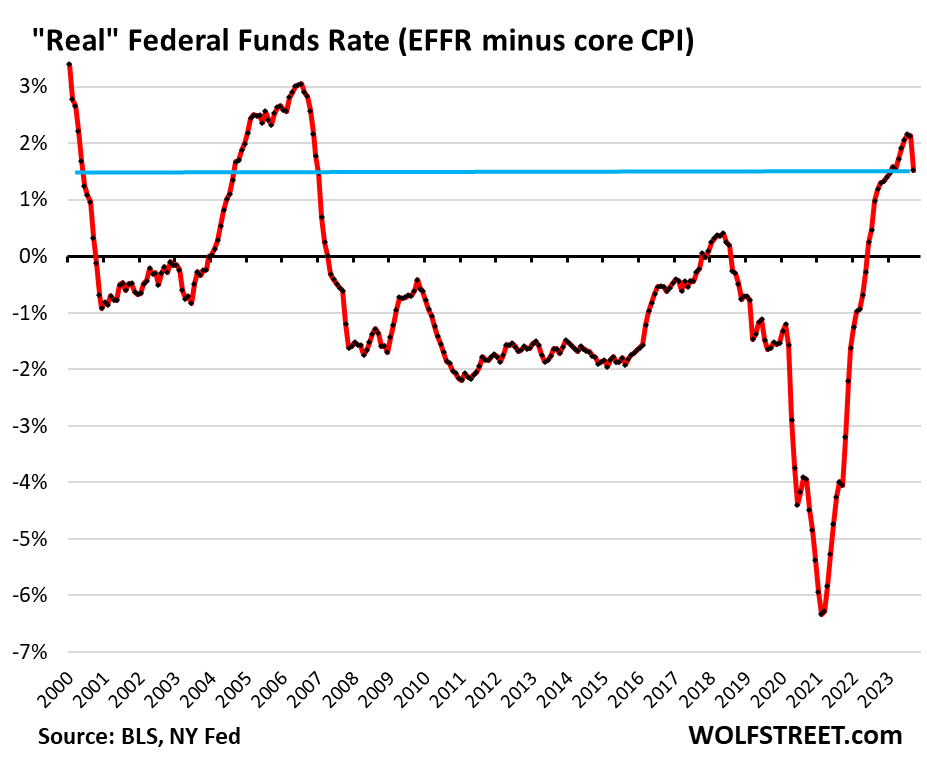
The assumption by the Fed is that policy rates that are substantially above inflation rates are above some theoretical “neutral” rate, and therefore are “restrictive.”
Fed governors have diverging opinions of where the neutral rate might be, since no one knows since it’s just a conceptual rate, and therefore diverging opinions on just how restrictive the current policy rates are – but they agree that they are restrictive, at least to some extent.
But what we’re seeing in the economic data is that policy rates may not be restrictive after all, that the “neutral” rate may be higher.
Yet the Signals Diverge
Some sectors have gotten hit really hard by those higher rates, especially commercial real estate, which has been in a depression for two years. For CRE, which had entered into a frenzy during ZIRP, financial conditions are strangulation-restrictive now. But that may be helpful in wringing out some of the excesses and in repricing properties to where they make economic sense.
Manufacturing, after the boom in manufactured goods during the pandemic, has been about flatlining at a high level.
But other sectors are flying high and are ascending further, including consumers.
At the extreme end of the highflyers, the spectacular bubble in AI triggered a vast investment boom – from construction of powerplants and data-centers – fueled apparently insatiable demand for specialized semiconductors, stimulated hiring and even office leasing, stimulated waves of corporate spending and investment, and waves of investments by venture capital in startups with AI in their descriptions. For anything related to the AI bubble, interest rates appear to be hugely stimulative.
Given where inflation is currently – 12-month core CPI at 3.3% – and where the Fed’s policy rates were before the rate cut – at 5.25% to 5.5% – it made sense to cut rates to bring them closer to the inflation rates, but keeping them well above the inflation rates.
The media has declared victory over inflation, not the Fed
The problem arises if inflation gets on a consistent path of acceleration. Powell and Fed governors have pointed at this risk many times. They’re fully aware of this risk. They’re leery of inflation going the wrong way again in a sustained manner. Inflation has been going the wrong way in recent months, but for a sustained acceleration, we’d need to see a lot more bad data, given how volatile the data is, to establish a solid trend. And they’re leery of that. They have not declared victory and have said so. But the media has declared victory over inflation, no matter what the Fed or the data say.
If there is an acceleration of inflation, the Fed can pause rate cuts for more wait-and-see. And if incoming data before the November meeting go in that direction, wait-and-see would be a prudent thing to do.
And if wait-and-see doesn’t work in halting the acceleration of inflation, if rates are not restrictive enough to hold inflation down – this likelihood rises with each rate cut – the Fed can hike again. Rate cuts are not permanent. Those scenarios are starting to show up on the horizon again.
The current situation also suggests that higher rates may actually be good for the overall economy, especially over the longer term, including for the reason that a considerable cost of capital fosters better and more disciplined and more productive decision making.


I love Wolf, but using average hourly earnings is not a good way to look at it. The Median would be a better look, and FRED doesn’t trabk this. The closest FRED has is the weekly Median earnings, which doesn’t look as good.
also the IRS tax data which they publish in aggregate form.
IIRC, the median tax return has adj. gross income of something like $2x,000. Or something surprisngly low in that range..definitely nowhere near the average wage × 2000 hours.
Wolf assiduously avoids any discussion of income or wealth distribution, relying as he does on topline macroeconomic aggregates. I don’t point this out as a personal failing of his — it’s a “feature” of the neoclassical economic orthodoxy: their models literally do not acknowledge the existence of such distributions, let alone that they are problematic.
I sometimes try to raise such issues in the comments over there, but I don’t get much traction.
agreed. with about 40% of the population has to chose eat, or have a roof over their heads, let alone make car payments, bodes ill for any flag waving over a irrelevant number like the GDP, which almost all goes to the few.
and with long long ridiculous supply chains that have gutted americas ability to create value and a high standard of living, coupled with just in time inventory, means the parasites think they can stretch out ever higher inflation because they do not have huge inventory build ups.
of course the obvious that the parasites miss is, that there comes a tipping point where prices have so out stripped wages, that consumption falls no matter what.
just look at the color of hair these days in stores and restaurants, a lot of gray hair, in fact, gray hair more than young hair, especially when paying.
which means social security is holding up retail, sorta. with inflation now out stripping cola’s again, this to will end in less consumption.
deflation and a ever worsening depression could be the outcome.
along with social security holding things up (barely?) I’d like to add increased min wages in high cost states look good on paper, and the current admins free hand with the strategic reserve
https://www.eia.gov/dnav/pet/hist/LeafHandler.ashx?n=PET&s=WCSSTUS1&f=W
Sad if something were to hit (pun intended) the oil supply
Yes, the cash in the economy is not evenly distributed. Those CD’s and T-Bills are NOT bought by those under 30.
I’m on a college campus in an affluent city, and the basic needs distribution (food, clothing, rental assistance) to a large portion of students is unsettling. While some students arrive on campus in new electric cars, many arrive via bus and a hand-me -down-jalopy. Many work as much as 30 hrs. a week and come to class sleep deprived.
For them the crash landing has already arrived.
20% of the population will keep paying, because they are doing very well. And 20% of 330 million is still a huge number.
but that is not near enough to support the retail situation in this country. with retail shrinking due to the lack of disposable income, lots of store closures, this adds to the pressure on the PMC class also.
in the end, 20% of the population? me thinks is not enough to keep even a radically shrunk down consumer based economy afloat.
the real estate losses, the massive cutbacks affecting not only workers, but the PMC class that the free trader mental midgets rely on, will shrink also.
no need for all of those managers, no need for all of those bankers, insurance, real estate PMC class, etc.
in the end, no amount of money thrown at the parasite class, can keep this afloat.
There is lots of gray hair at checkout stands and restaurants because there are loads of baby boomers in the population who have bucket lists and fistfulls of money. Airports are full of gray hair as well. Many of these boomers do not depend on SS to provide the bulk of their retirement income. They are living off of assets they acquired on the relative cheap and now worth many times more.
depends on who’s reality you speak of.
https://www.economicpolicyresearch.org/resource-library/research/lowballing-elder-poverty-who-counts-as-poor-in-america
Lowballing Elder Poverty: Who Counts As “Poor” In America?
July 10, 2024
Share
Print
Email
Relative senior poverty levels are more than double the official U.S. rate.
“More than 12.4 million Americans aged 66 and older are poor, according to internationally-accepted relative poverty standards – far more than the 5.8 million counted in U.S. official absolute poverty rates.”
————-
https://www.seniorstrong.org/how-many-seniors-live-only-on-social-security/
‘Based on a Gallup poll conducted in 2022, 55% of retirees rely on Social Security as a major source of income, compared to 33% of near-retirees who expect Social Security to be their major source of income after retiring.”
———————-
not so rosy is it. you must move in PMC class.
As a PhD (ECON) from around Wolf’s age, you are so correct here. I struggled to get through my courses because I came from lower, lower middle class and nobody seemed to understand how the averages were basically farking over many tens of millions of people!
I posted a comment recently on Richter’s site about one of his “drunken sailor” posts. My criticism was that his analysis was suspect due to the aggregate problem and the absence of income source and distribution.
The comment was up for about 30 minutes before it was deleted.
Wolf suppresses comments so they never see the light of day, deletes comments that get thru, and has said he alters comments.
Why does Wolf allow comments when he seems not to like many of them and thus removes or alters them? Seems silly to me.
He does get some really insane comments. It would be better if he had some police comments before they showed, but it seems like a one man machine over there.
I doubt my opinion counts much over here since I rarely comment, but Wolf has a lot of good mixed with a little bad IMHO.
Yes, reading that “households are not only flush with cash but kept adding to their cash holdings”, I can only guess he’s talking about some zip code far from the one I live in. Once again, averages are the most misleading statistic that statistics freaks love to misuse.
I also would love to see the Median on those savings rates.
It’s amazing how much assets have inflated, I read a report where homeowners on average have gained 200k in equity since 2019. Just by the Fed suppressing mortgage rates. It is totally insane.
Even before reading the 9th paragraph, I wondered if immigration was impacting the economy. I guesstimated immigration at about 4 million or about 1% of the US population each year, which would be a greater % vs working population, which was close but not accurate. Of course that’s based on the article figures. I also assume official figures on immigration are below reality, based on what I’ve seen in real life. So yes, 1% each year does help explain why the “economy” “grows” each year while so many feel they are not benefiting from the growth. Though probably many immigrants are happy and feeling better off. Add upward flow of wealth to the already wealthy and it gets worse.
Just returned from evacuation pre-Milton to Ocala, FL. Could have stayed home, as it turned out, house fine, neighborhood never lost power —but who knew? Stayed at a nice pet friendly hotel. Large service staff, very accommodating people. Pretty much mono-lingual in espanol other than management which seemed sort of bilingual. Taco truck in the parking lot. Latino (-x?) barbecues in the evenings behind the kitchen (staff break area.) Patronized maybe five local businesses including Target, Walmart, restaurants, gas stations, the workers were largely Spanish speakers. Talked to a few, that random pick included Honduras and Venezuela.
Ocala is “horse capital of the world,” horsey estates and breeders in all directions. City motto is “God be with us.” Population per 2020 census around 64,000. Pretty typical US city. Not too many “threatening” MAGA pickup trucks or other hostile signs No notion overall of frictions,1 but through my small window, looks to be a reasonably mild incoming of migrants. Pots boil first at the bottom, so who knows what kind of community we’ll be developing there. Here in Largo, still pretty much Anglo culture but some visible signs of Latinx infill.
I wish I’d learned Spanish instead of studying German, Latin and French. But hey, I’m 78, so may not be an impactful issue for me. Wishing the best to us humans as we struggle through all the changes.
I share your affection for immigrant culture and neighborhoods. I have an ex husband who came from Brazil, did what they call a fake marriage to an American women (at the time the Brazilian would pay the pretend wife 15k or more) to get a green card then citizenship.
Remittances are a real thing, especially for the much smaller Central American countries.
here are some outdated stats of workers sending income back to their home country.
https://en.wikipedia.org/wiki/Remittances_from_the_United_States
In 2023, >$60 billion was sent to Mexico
https://www.bakerinstitute.org/research/economic-lifeline-how-remittances-us-impact-mexicos-economy
It is perfectly easy to see a future where, due to environmental degradation/constraints, war or the reversal of globalisation, prices rise ever higher. Indeed, given prevailing environmental pressures, it is surprising that prices have not yet risen significantly.
All this would be bad enough but for the fact that the welfare systems of developed nations which provide indexation may be unable to cope, and those welfare systems which are characterised by defined contribution saving (which frequently offers no protection against inflation) may tumble into a vortex of increasing pensioner poverty. Many elderly people are more worried about running out of money than of developing a terminal illness, especially where they must self-insure (very expensively) for any social care needs.
Given that the UK has negligible natural resource endowments, is highly dependent upon cheap imports (and as been a net importer of energy since 2004), and the overwhelming majority of the working age population has inadequate defined contribution pension savings, the prospects of such a vortex are becoming all too real, which is why it is all the more curious that its governing class supports US policies in regions like West Asia which seem certain to guarantee higher prices (the UK state pension which is protected from CPI, for the time being, is extremely ungenerous, even for those who have a lifetime of saving). Or perhaps it is not so curious when it is recalled that the British governing class has defined benefit entitlements which are either partially or wholly protected from the effects of inflation.
Thank you and well said.
I have linked this post and your comment at Richard Murphy’s: https://www.taxresearch.org.uk/Blog/2024/10/15/there-is-class-warfare-going-on-in-this-country-now-and-it-is-labour-waging-it-on-the-people-of-the-uk/comment-page-1/?unapproved=990000&moderation-hash=a5484e6230cd0ce91f7316d3e089e1ce#comment-990000.
I don’t disagree with the general thrust of this but actually the UK has some natural resources:
– pasture land; crop land; woodland (mainly in Scotland at scale); all of these pretty well hedged against climate change
– productive fisheries
– coal (still plenty underground)
– iron ore (I believe, possibly not economic to mine), copper, tin etc.
– oil and gas (some left, more if tracking is considered or if Falklands etc. taken into account)
– unparalleled waste resources: 200 years of industrial urban living, all in landfill ripe for mining, plus more plutonium and spent uranium fuel than you can shake a stick at.
We lack access to rare earth metals and raw uranium. We could probably be self sufficient in the rest at considerable financial and environmental cost. I am not suggesting that the UK has economic resources but it does have, in wartime conditions, strategic resources.
UBI will accomplish that and continue inflation for another 20 years.
A Bunch of Massive Up-Revisions After the Fed Meeting. Hmmmm. Did these follow a bunch of purposely low-balled numbers? Again I will speculate that the half point rate cut was a bailout for the over leveraged crowd.
Kind of like they threw a speedo out to some folks swimming naked.
Lol. That’s how we do bailouts.
Imo, controlling inflation was not the motivator for the cut, just the talking point.
Hmmm. Now I see “Boeing to borrow billions”. Coincidence?
An item worth noting is that the US economy has become so financialized and the US debt so large any changes in interest rates really need to be looked at from both their positive and negative growth effects.
The US Treasury is forecast to pay out nearly $900B in interest payments this year. While most of this will just become more savings and go unspent, if 10% of it is spent or leads to people spending more that still amounts to a $90B fiscal stimulus package. Falling rates should cut that stimulus.
Additionally, the financial system has been loath to raise interest rates on deposits, so their spread has become fairly large. The Finance and Insurance industry was the second largest contributor to GDP growth in Q2. While economic statisticians count FIRE in the measure of GDP, it’s really not a real economic output so when it’s the #2 component in the GDP reported growth you need to know that that GDP report is actually overstating real economic growth by a fair amount. Falling rates will shrink the interest income-expense spread and that should reduce FIREs share of reported GDP growth.
Your first point has been made repeatedly by Warren Mosler — that higher interest rates can be stimulative via the interest income channel, and that this effect of rate increases is much more materially significant now with elevated levels of US Federal debt than they would have been during the “canonical” (all orthodox economists are basically closet priests) Volcker era.
That’s a lot of words, especially about private sector savings without even once mentioning what I consider to be the most significant contributor — the US Federal government is currently running record “peacetime” (well, Congress hasn’t declared war, so it’s still officially “peacetime” amirite? 🙄) deficits. Wynne Godley’s sectoral balances analysis tells me that those deficits as a matter of simple accounting identities must appear as credits in accounts somewhere as private sector savings.
Again, this won’t tell us anything about the distribution of those savings, but my instincts tell me the effects will be unequal, and perhaps grossly so.
It is convenient that the adjusted figures are released after the US government has determined the COLA for next year to be 2.5%, based on “successfully taming inflation”. It will be interesting to see if there are further adjustments next month after the elections.
I continue to argue that we crossed the Rubicon during the COVID panic of March 2020.
Not only the Cares act with its reckless confetti cannons pointing in every direction, but also the Fed’s backstop of corporate debt (including CCC rated junk!) with Blackrock hired as the Fed’s lackey to slurp up that toxic soup of crummy corporate debt. They didn’t actually have to buy that much, but the precedent was set. Nothing will ever be allowed to fail, except the little guy.
It’s a confetti money economy now, and your number one imperative is to position yourself to rake up the confetti, put it in your wheelbarrow, and get your ass to the Walmart or the Loubotin store before prices rise. Go Weimar USA!
Assets don’t get repriced until big players are positioned or re-positioned to take advantage.
Germans called the Weimar hyperinflation banknotes ‘Jewish Confetti’ and in a normal old school way of doing things, we would be locked in a hyperinflation spiral, if that $35 Trillion in debt was taken seriously.
Interesting – history rhymes!
“But starting 11 days after the Fed’s decision, the revisions and new data arrived. And the whole scenario changed.”
The Fed knew revisions would be coming and still did the 50 basis cut. They continue to say they are data driven and with all the head spinning revisions witnessed in the past they still did 50 and not say 25.
Some people continue to act like they can’t smell a rat.
“Households are not only flush with cash but added to their cash holdings”–W.R.
Whose households? Not this oikos, nor a whole lot of others.