Yves here. Even before Trump’s price-goosing tariffs are at risk of coming into play, key inflation metrics are going the wrong way.
By Wolf Richter, editor at Wolf Street. Originally published at Wolf Street
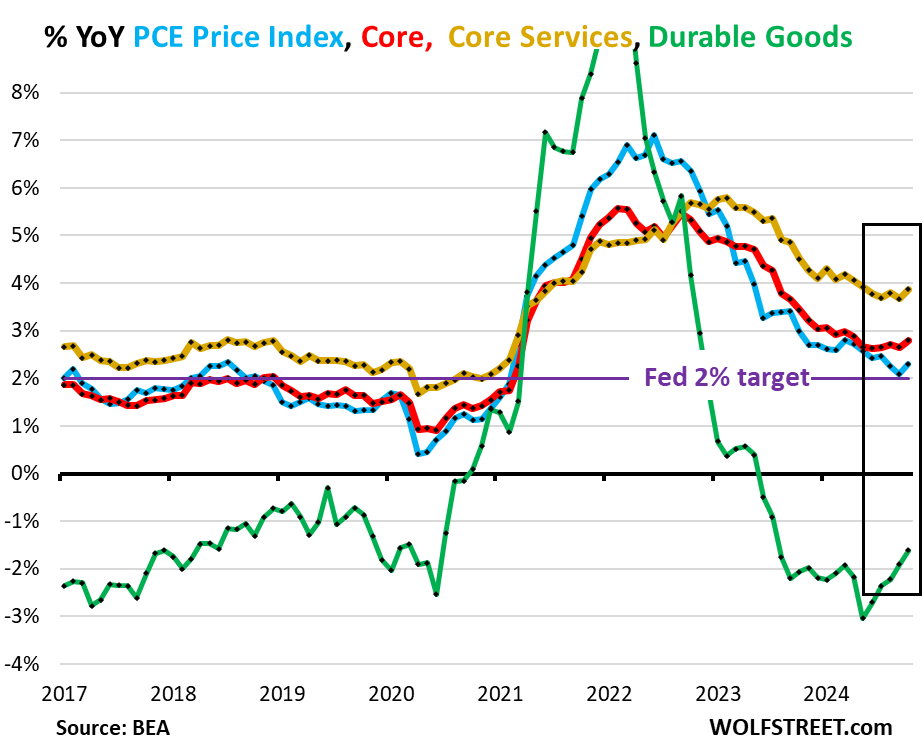
Inflation has been in services and is still in services, it has become sticky in services, and recently it has been re-accelerating in services. Services dominate consumer spending. And durable goods prices rose for the second month in a row, after big drops. But gasoline prices continued to plunge, and food prices ticked up just a little, according to the PCE price index by the Bureau of Economic Analysis today. This is the data the Fed prioritizes as yardstick for its 2% inflation target.
Three of the four major metrics accelerated in October even on a year-over-year basis: the overall PCE price index to +2.3% (blue), the “Core” PCE price index to +2.8%, (red), and the “Core Services” PCE price index to +3.9% (gold), while the durable goods PCE Price index started rising from the ashes and became less negative (green).
The Fed has already been talking down the pace of future rate cuts recently, including in the meeting minutes yesterday and in speeches by Fed governors.
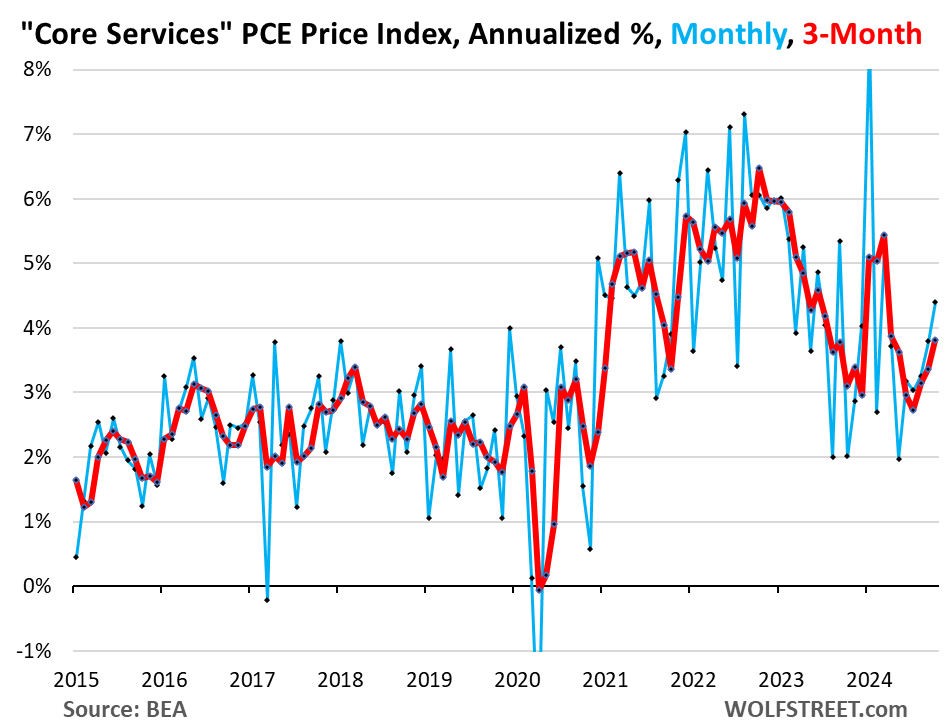
The driver: “Core Services.” The PCE price index for “core Services” accelerated to +4.4% annualized in October from September (+0.36% not annualized), the sharpest increase since March (blue in the chart below). The three-month core services index accelerated to 3.8% annualized (red).
Core services include housing, healthcare, financial services & insurance, transportation services, non-energy utilities, communication services, recreation services, food services & accommodation, and “other” services. But it excludes energy services, such as electricity to the home.
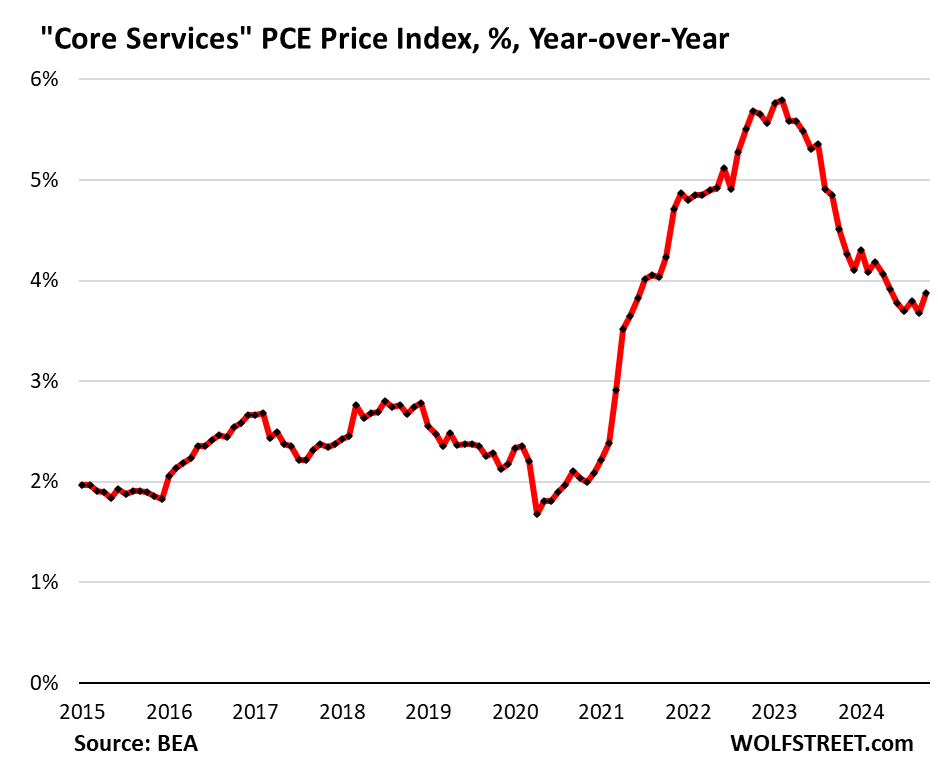
Year-over-year, core services PCE price index accelerated to 3.9%, the fastest increase since May. There has essentially been no progress since May:
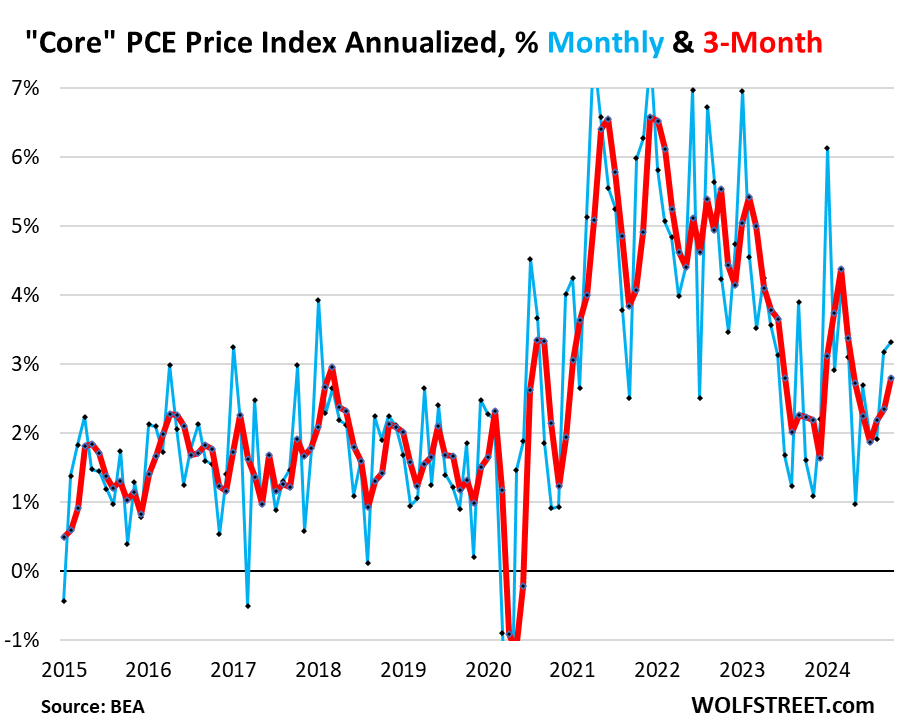
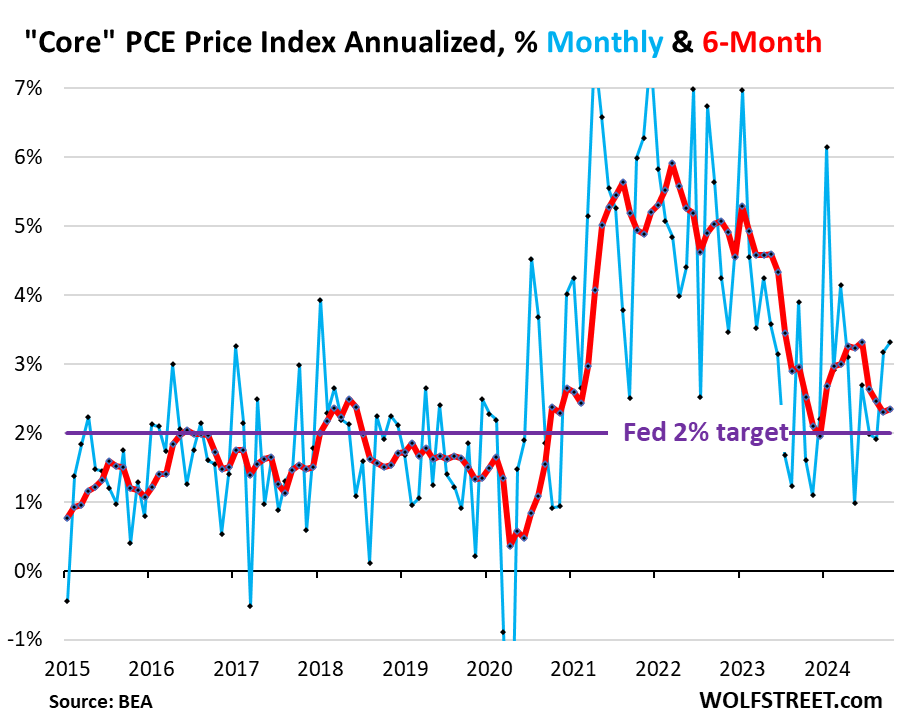
The “core” PCE price index accelerated to +3.3% annualized in October from September (+0.27% not annualized), the biggest month-to-month increase since March.
This month-to-month acceleration was driven by the jump in the core services PCE price index (see above).
The “core” index attempts to show underlying inflation by excluding the components of food and energy as they can jump and drop with commodity prices.
The 3-month core PCE price index accelerated to +2.80% annualized, the third acceleration in a row, and the fastest increase since April (red).
The 6-month core PCE price index accelerated to +2.34% annualized (red), and has remained higher all year than it had been at the end of last year:
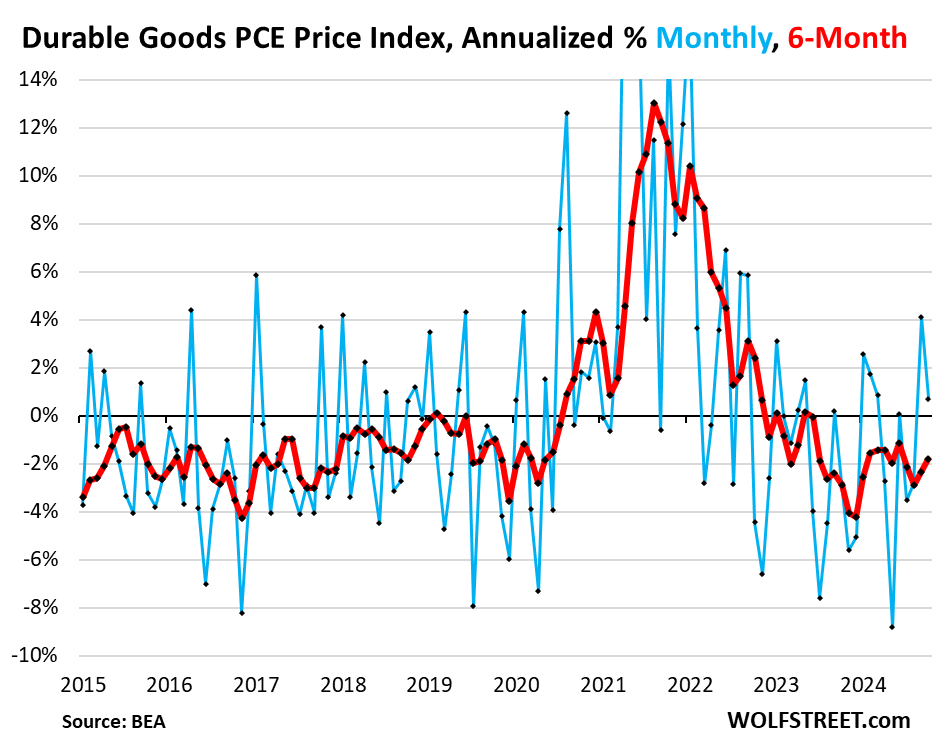
The durable goods PCE price index increased by 0.7% annualized (+0.06% not annualized) in October from September, on top of the big jump in August, which had been the biggest increase in two years, after a series of steep negative readings (deflation).
In October, the month-to-month increase was due to motor vehicles, while prices fell for household furnishings & appliances, recreational goods & vehicles, and “other” durable goods.
As a result, the 6-month index became less negative (-1.8%, red line).
And the year-over-year index also became less negative, see green line in first chart at the top (-1.6%).
In recent decades, durable goods prices trended lower on average due to manufacturing efficiencies, technological improvements, and offshoring production to cheap countries (globalization). Over these decades, the driving force in inflation has been services. During the pandemic, durable goods prices spiked due to the sudden demand fueled by massive economic stimulus that made consumers suddenly willing to pay whatever for goods, and there was huge demand for goods, overwhelming supply chains, giving companies enormous pricing power, and they used that pricing power:
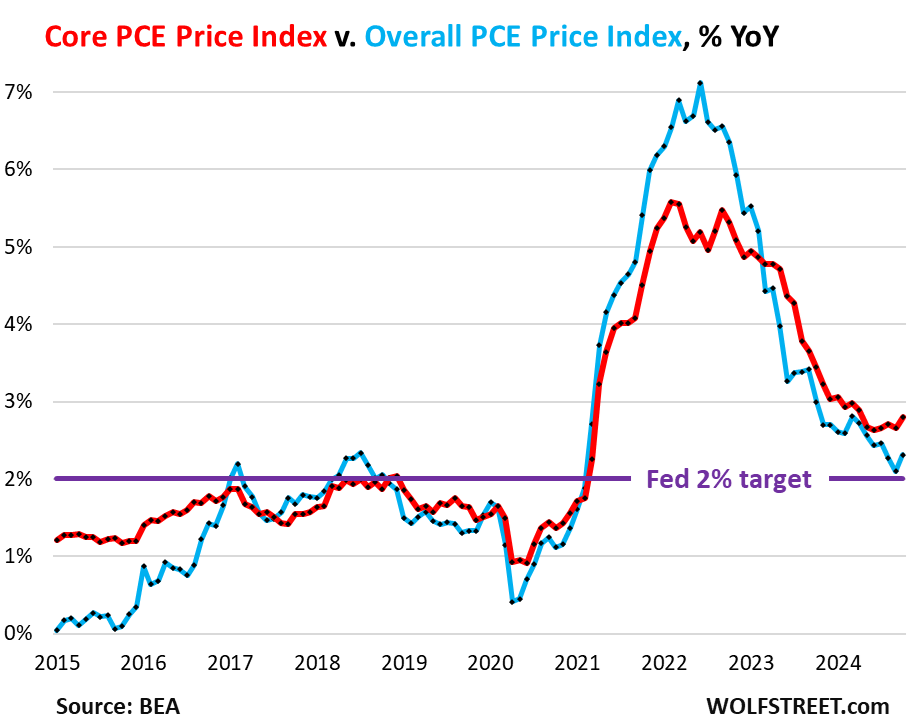
The overall PCE price index, which includes the food and energy components, rose by 2.3% year-over-year in October, an acceleration from September (+2.1%), despite the plunge in gasoline and other energy prices of -12.4% year-over-year and -1.0% month-to-month (not annualized).
Food and energy prices make up the difference between the overall PCE price index (blue) and the core PCE Price index (red). The price spikes of food and energy in 2021-2022 caused the overall PCE Price index to shoot to +7%, while the core PCE price index, which tracks the underlying inflation beyond commodities prices, topped out at 5.5%.
As energy prices have been plunging starting in mid-2022, the overall PCE price index decelerated faster than the core PCE Price index, leaving the core PCE price index with a higher rate.


Why should there be inflation in services? What is making productivity in services less efficient relative to investment? Is it just that there is too much investment and not enough return, suggesting perhaps not enough demand?
Shortages in lower-wage workers who are the backbone of the services labor force and probably a lot of turnover in that cohort. Hiring and training replacements = lower productivity.
The lower wage workforce is also full of Boomers who are retiring and for the ones hanging on its harder to maintain (or increase) productivity in physically demanding jobs as you age.
Additional cost of the employee, increasing benefits provided by the employer , cost of providing health insurance, added burdens by States mandating benefits to be provided.
I think I disagree – no offence. The added burdens of of increased benefits, health insurance and states – like is their any correlations where I can see this?
What is the impact of rent or lease space cost on the business expense side. As I recall – a lot of expense was just not covered while Covid raged – I sure could be wrong.
and then
“durable goods prices spiked due to the sudden demand fueled by massive economic stimulus that made consumers suddenly willing to pay whatever for goods, and there was huge demand for goods, overwhelming supply chains” – I disagree with the cause effect here, again I could be wrong but, didn’t the crippling of the actual supply chain and a choking off of actual supply due to distruptions of covid actually create a supply shortage
and not, I don’t think, a huge demand increase for goods cause people were suddenly flush canard.
I am thinking that If you are making these durable goods and have got to make your debt payments and overheads no-matter that your production cycle was interrupted.. well that tends to leave a hole of cash that needs to be made-up so what better than to raise prices( and even gouge a little. wink-nudge) to make everything look good while scapegoating and chiseling your workers.
You know how it is – Like the financial wizards looking for a hand out from the Gov. We can’t make ends meet, even though we are the penultimate geniuses of business, so please won’t you help us out.
or here, Golly, are durable goods are just to durable, we can’t make a buck with all the leverage were under, were experts at this stuff and we just can’t make a buck paying folks a fair wage…..and by or thinking…it’s these workers taking advantage of us ‘job creators’ so please give us a hand.
I could be totally off base… so if I am, I apologize.
inflation is going up no matter tariffs or not,
china now has whats called pricing power. they really have no competition from american factories, those factories are all gone thanks to bill clintons free trade and the gutting of the new deal. so now china raises prices, and everyone in that supply chain from china to america, all add their own price hikes. there is your inflation.
https://www.yahoo.com/finance/news/chinas-factory-prices-rise-fastest-014559163.html
tariffs alone will not work very well, that ship sailed when bill clinton gutted ameria for the benefit of a few.
But the China price is still a thing. I just bought a carb for my leaf blower. Included a spark plug, gaskets, and fuel lines and filters.
$11. that’s cheap
And then there was the 400 grit/1000 grit diamond stone. $20
I keep thinking that higher wages in China are going to increase the prices of their exports but largely I aint seeing it.
Maybe stuff at Horrid Fright has gotten a little more expensive but not much.
I think their increased use of automation has more than compensated for higher wages.
buying from other countries is debt. if you lose your standard of living and technology for cheap foreign made stuff, plus driving up your debt, then it ain’t such a good deal.
so some if the inflation we are experiencing since 2021, is import related.
I’ll just add these management wizards who can’t make their numbers work without tamping down wages and jacking prices are the same ones who threw billions upon billions away on stock buybacks instead of using it for capital investment, personnel development, or stowing for a rainy day.
I could also be totally off base, but I think it all goes back to the rent is too high and even the immigrants in my midst need a raise to pay for it. Add in increased min wage costs at the coffee shop getting passed on which happened in cali this past spring. Also the pricing power of the ubiquitous monopoly industries and where else are you going to go industries such as health care. I’m not optimistic that there will be an improvement in the foreseeable future. I’m sure considerable effort will be made to blame the new admin, but it’s been the same as the old admin…tag team kayfabe. Gorgeous George or Andre the Giant, a body slam is a body slam…
There is no higher or additional cost of employee which is not chosen by the employer, employers are not forced to reluctantly hire an employee at some higher cost which they’d prefer not to pay.
In my field, fintech, we would prefer to hire a $90+/hr contract worker for 6-12 months than pay benefits for a full time employee who would make $15-50/hr, even if that means some CW’s are making more than higher level directors or veeps. CW’s don’t incur expenses for payroll taxes, benefits, insurance, are not entitled to severance. So the preference is to have a higher ratio of CW’s to FTE’s. It has the bonus of inflating your resource budget (and therefore status) and you can quickly expand and contract your workforce. If you have a workforce artificially inflated at $20M with higher CW to FTE mix and you’re asked to downsize to $15M, it’s no problem at all, whereas if it’s more FTE than CW then there’s an overhead cost associated with the cut. The only downside is quality and big gaps in knowledge transfer due to churn and who is tracking that, how do you quantify it, do managers even care? So at least in my field the cost of employee is very considerably (and artificially) inflated.
I wonder, if the entire workforce were switched to FTE (as in, employers pay benefits, insurance, taxes) would cost of services come down, dramatically even?
Also, benefit and insurance deductions are usually taken from an employee’s own paycheque unless there’s some employer contribution.
I work in manufacturing and we absolutely track quality (scrap, rework, warranty costs) and productivity, both of which have seen drops as experienced workers are retiring and new employees are hired. The lack of a training pipeline of employees due to “lean” initiatives and cost cutting over the last 15-20 years is now bearing fruit due to the lack of knowledge transfer/continuity. We are seeing this in many of our suppliers as well.
We are having to increase our pricing where we can to cover these increased costs and since our products are highly customized and not high volume, our supplier base is narrow. We have very limited flexibility at the moment and are just having to live with the issues and try to address them with additional training and supplier support (which also costs $$).
“High touch” services are very difficult where productivity increases are concerned. Think here for example of barbers. This is what underpins “Baumol’s cost disease.”
I don’t know how many services fall into this category, but it’s not zero.
Well, in my experience (using healthcare as an example) it’s because of the opacity of pricing. I have recently had dental work service and the cost was a shock. There is no price discovery until you are ‘locked in’ to a particular provider. And then they tell you the original price presented to you was only an ‘estimate’. This defaults into hours of back-and-forth with your insurance administrator and the healthcare provider which leads to more office staff time and increases in costs, all around.
‘Caveat emptor’ is not possible in today’s ‘scam culture’.
“You chose to be our customer? That’s spelled “victim” sucker……”
Nontradable services have long been known to have what economists refer to as a cost-and low productivity disease. Check out the Baumol paradox.
https://en.wikipedia.org/wiki/Baumol_effect
….Many services have slow productivity growth, and in the case of some the very concept underscores the futility of applying criteria from “economics” to human activity (e.g. in the arts and other creative fields).
There is an issue of pricing power in areas like healthcare, housing, internet etc. As far as labor costs, combined with duties on consumer goods, inflation can jump sharply next year.
This narrative completely ignores the supply side of the story:
Global production in some industries such as automobiles declined during the early part of the pandemic, and this is an important part of the explanation of changes in the price level.
Also, demand shifted for some reasons that had nothing to do with “massive economic stimulus”. Consumers shifted spending away from services in favour of goods as it was not possible to maintain the pre-pandemic consumption pattern without risking infection.
And a lot of people got sick which affected labour supply.
To focus exclusively on stimulus is to distort reality.
This story never gets old.
People who think inflation has nothing to do with this, aren serious or have an agenda.
https://fred.stlouisfed.org/series/M1SL
We are only in the first inning of this.
Get ready for waves after waves of inflation while Fed pays lip service to their dual mandate.
Price stability is gone.
Pray that we escape the tsunami.
Not an econ guy, but your link piqued my interest and the chart shocked me to such a degree that I explored a bit and found that the M1 chart you linked may be less shocking than it appears (for various reasons), and that M2 is apparently at least equally relevant and shows less drastic change.
But like I say, not an expert. Your “tsunami” closer was good but oblique. Wonder if you care to “explain like I’m five.”
M2 is just as dramatic
https://fred.stlouisfed.org/series/M2SL
A tsunami would be a hyperinflation event.
It’s how historically all fiat currencies have ended.
We will get there eventually but if I knew the timing I won’t be here wasting my time.
M1 with Price Level. This story never gets told.
Sometimes it’s important to read the footnotes. From your link to FRED:
Your “tsunami” was caused by a change in definition of M1 in May 2020, in particular the inclusion of money market deposit accounts.
Thank you for the clarification. I think the most appropriate place to look is the M0: https://fred.stlouisfed.org/series/BOGMBASE which still shows an approximate doubling of the monetary base over a few years.
How will mass deportation affect inflation?
Well, it will be a certain boom to those in enforcement who get their big pay and retirement based on increased overtime pay by pushing their theme of how dangerous law enforcement jobs are…despite the fact that those deported have much more dangerous jawbs….as bush jr said without completing the sentence ‘their doing the jobs americans won’t do….and the part he did not say was….’for that kind of pay’
Well I am sure I will be supporting my local police with inflated taxes to compensate them for the ‘heroic and ‘dangerous’ work they do in order to maintain the scape-goat du-jour.
There are statistics and there are damned statistics. All these charts and tables need to be revised to reflect that there are two distinct economic classes in the US, the haves and the have less. In the latter, ‘inflation’ is measured thus: Do things cost more? Did I get a raise? Do I have to work more to get by? Somebody ought to do a ‘budget’ for the theoretic household which might fall into the ‘bottom’ 75% by net worth. Note: in the 1950’s & 60’s, middle class meant: Dad worked a 40 hr week, mom stayed home and took care of two kids, there was a chicken in the pot, two cars in the garage, and the kids would go to college to better themselves.” That so called middles standard might be found in the median modern household of the of top 25% by net worth in the US. A person doesn’t have to be a genius or a bond trader to figure out that servicing a debt, printing money, & tariffs will make things ‘cost more’.
I believe many of the accounting categories Wolf reviews in this post, which I believe are u.s. government defined accounting categories, do a poor job of accounting to portray the actual and perceived state of most American household costs and expenditures. Ask American households “How’s business?” and the u.s. government’s accounting fails to offer a clear picture of “How’s business”, while blurring where American households most feel the pinch, and blurring who most deserves blame and why. Examine the category core services: “Core services include housing, healthcare, financial services & insurance, transportation services, non-energy utilities, communication services, recreation services, food services & accommodation, and “other” services.” Core services have gone up, but where and why and for whom? My concerns are little quelled by bundling so many services into a ‘passively voiced’ core services have increased. The accounting reminds me of some of the accounting practices that I believe go into government unemployment statistics, the GDP, or some Corporate reports. Enron accounting for assessing households?
The discussion of the costs for durable goods: “In recent decades, durable goods prices trended lower on average due to manufacturing efficiencies, technological improvements, and offshoring production to cheap countries (globalization).”
seems to ignore what I believe is the extent that durable goods prices trended lower as a consequence of the financial squeeze on consumers affected big purchases. I am not so sure about the manufacturing efficiencies and technological improvements after past experiences repairing a broken clothes dryer, and a dishwasher. Neither appliance showed much indication of any technological improvements, though I am not sure about manufacturing efficiencies. The guts of the appliances I worked on, appliances that were not all that old, looked so antiquated I cannot imagine what improvements they might incorporate.
There is also the “hedonic adjustments” that are made to consumer goods. If a computer is far more capable that a model from last year and the new computer costs 15% more, it might not be regarded as inflationary in the stats as the consumer could be getting 20% more “value”.
Search for “quality adjustment in the CPI”.
Of course, if one were forced to replace a failed, but adequate product, with a more expensive but “higher value/quality ” product, one might regard this as inflation as it comes from the consumer’s wallet.
You are both on to something here. Wolf relies upon aggregated data which hides pernicious deltas across the income and wealth distributions.
I’ve figured this before, but when I go over your services list I think it again. Instead of ‘high touch’ maybe it’s just considerable interaction with lots of humans. Which means the status jobs have less. Which tends to reverse the gregarious nature of humans in general [a little doublethink required to accept this?]. It looks like it becomes the ultimate pain. Go to work where there’s high interaction, and the low wages, precarity, and angst make you want to leave in six months. Normal capitalism would be ten times better, but we’re not exporting enough. Seems to me a tough dilemma. When it comes to the employer’s shell out problem with not CWs, there’s where you need some MMT…not for cluster munitions. But given the track they’re on now, the only way corporations will get folks to buy their stuff is getting higher wages to the low wage people. The corporations are being out competed anyway; the only solution I think is to humbly adapt, Rooseveltian.
Check out Tim Morgan’s latest where he uses his SEED’s framework to show that his Realised Rate of Comprehensive Inflation in place of the GDP Deflator shows no per capita growth in the US over the last 5 years.
That is most peoples lived experience in most of the world if you aren’t high up on the Cantillon effect ladder. Just massive churn as desperation sets in.
Tim Morgan’s “Surplus Energy” explanation for the functioning of the world’s economy has great appeal to me.
But my background is electrical engineering, not economics.
Human “productivity” that is measured from the output from machines (built from ancient hydrocarbon energy) and ancient hydrocarbon energy spent in their operation, does seem a gross exaggeration of human productivity.
And the earth’s hydrocarbons are ancient.
From a google search:
“70% of oil deposits existing today were formed in the Mesozoic age (252 to 66 million years ago), 20% were formed in the Cenozoic age (65 million years ago), and only 10% were formed in the Paleozoic age (541 to 252 million years ago).
More efficiency in the use of increasingly scarce resources is possible.
Morgan suggests humans are “energy diverters” NOT “energy producers” and as energy gets more costly, the world economy will have a very difficult adjustment, particularly in the UK.
This could result in more local and smaller economies, perhaps fewer wars, unless, a nation follows a version of the Carter Doctrine to ensure THEIR national energy supply is maintained.
But I’m not optimistic that the USA will respond at all responsibly to the energy issues of the future.
Because….the economy.