Yves here. So much for saving the planet. Many experts had warned that AI, particularly power-hungry US implementations, would greatly increase energy demand. It’s already taken off even before Trump repudiated reducing carbon emissions and other environmental protections.
By Wolf Richter, editor at Wolf Street. Originally published at Wolf Street
The quantity of electricity generated in the US by all sources, from natural gas to rooftop solar, rose by 3.1% in 2024 from 2023 to a record of 4,304,039 gigawatt-hours (GWh), according to data from the EIA today.
This is now clearly a breakout in demand, after 14 years of stagnation, from 2007 through 2021, when electricity users, to reduce their costs, invested in more efficient equipment – lights, appliances, electronic equipment, industrial equipment, heating and air-conditioning, etc. – and in better building insulation, shading, etc., to reduce their power costs. This relentless drive for greater efficiency kept demand roughly stable for years despite the growing economy and population. And it mired many power generators and electric utilities in a no-growth business where it was difficult to justify investment.
Now the scenario has changed, largely due to the growth in demand from data centers (AI, cloud, crypto) and the increasing penetration of EVs in the national vehicle fleet – EVs accounted for over 10% of US vehicle sales in 2024.

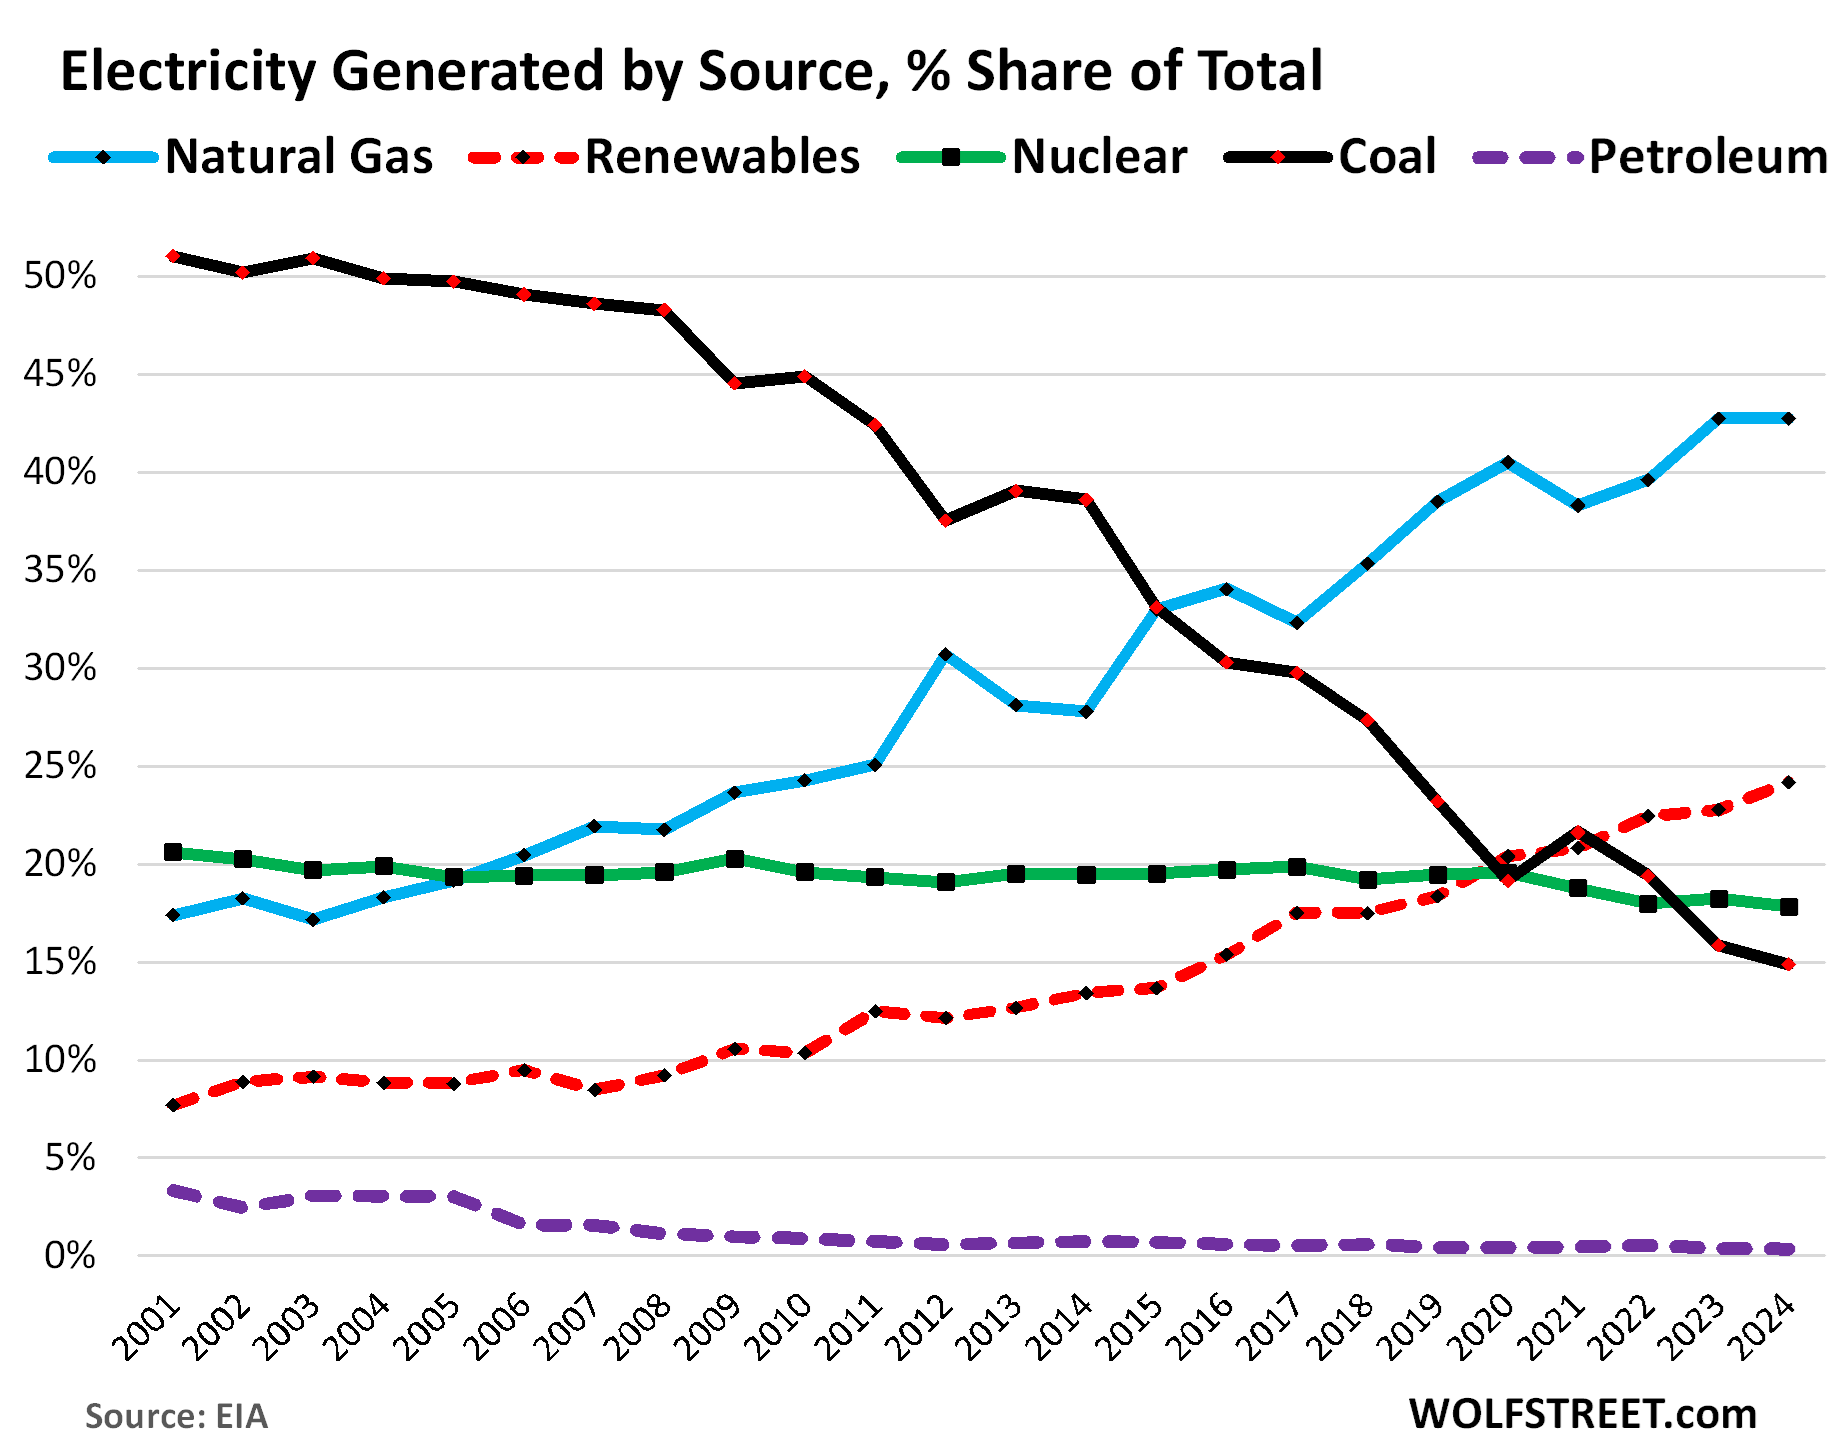
The Share of Total Electricity Generated by Source:
Natural gas rules. Power generation from natural gas rose by 3.3% to a record of 1,864,874 GWh in 2024.
The share of natural gas as source for power generation remained roughly unchanged in 2024, matching the record of 42.7% of 2023, about double its share in 2007. Natural gas had surpassed nuclear in 2006 and coal in 2016 (blue in the chart below).
The US is the largest natural gas producer and the largest LNG exporter in the word. Production has oversupplied the US market and has caused the price of natural gas to collapse since 2009.
The modern combined-cycle gas turbine powerplants have a thermal efficiency of around 65%, nearly double that of older coal powerplants. These two – low price of US natural gas and the high efficiency of the combined-cycle plants – made natural gas immensely attractive for power generators.
Coal power generation fell by 3.3% to 652,760 GWh in 2024. Its share dropped to a record low of 14.9% of total power generation, down from 51% in 2001 (black in the chart below).
Coal cannot compete with cheap natural gas and the efficiency of a combined-cycle gas turbine powerplant. More recently, wind power became more cost-efficient than coal. It all boils down to costs. Gas is cheap. With renewables, the “fuel” is free; and all methods of power generation require costly plants, equipment, maintenance.
Power generators have not built any new coal-fired power plants over the past decade. They’re too inefficient and expensive to operate.
And they’ve been retiring their old inefficient and expensive-to-operate coal-fired power plants. In 2025, of the 12.3 Gigawatts (GW) of capacity that power generators plan to retire, 66% are old coal-fired plants, 21% are old natural-gas-fired plants, 13% are old petroleum-fired plants.
Generation from all renewables combined – wind, solar, hydro, geothermal, and biomass – rose by 3.1% to a record 1,061,258 GWh, driven by surging generation from wind (+7.7%) and solar (+26.9%).
The share of all renewables combined increased to 24.2% of total power generation (red). More on them separately in a moment.
Nuclear power generation edged up 0.9% to 781,979 GWh, and its share edged down to 17.8% of total generation (green).
The share of petroleum liquids and petroleum coke declined to 0.3%, having nearly vanished as source of power generation. The planned retirements this year will further reduce generation (purple).
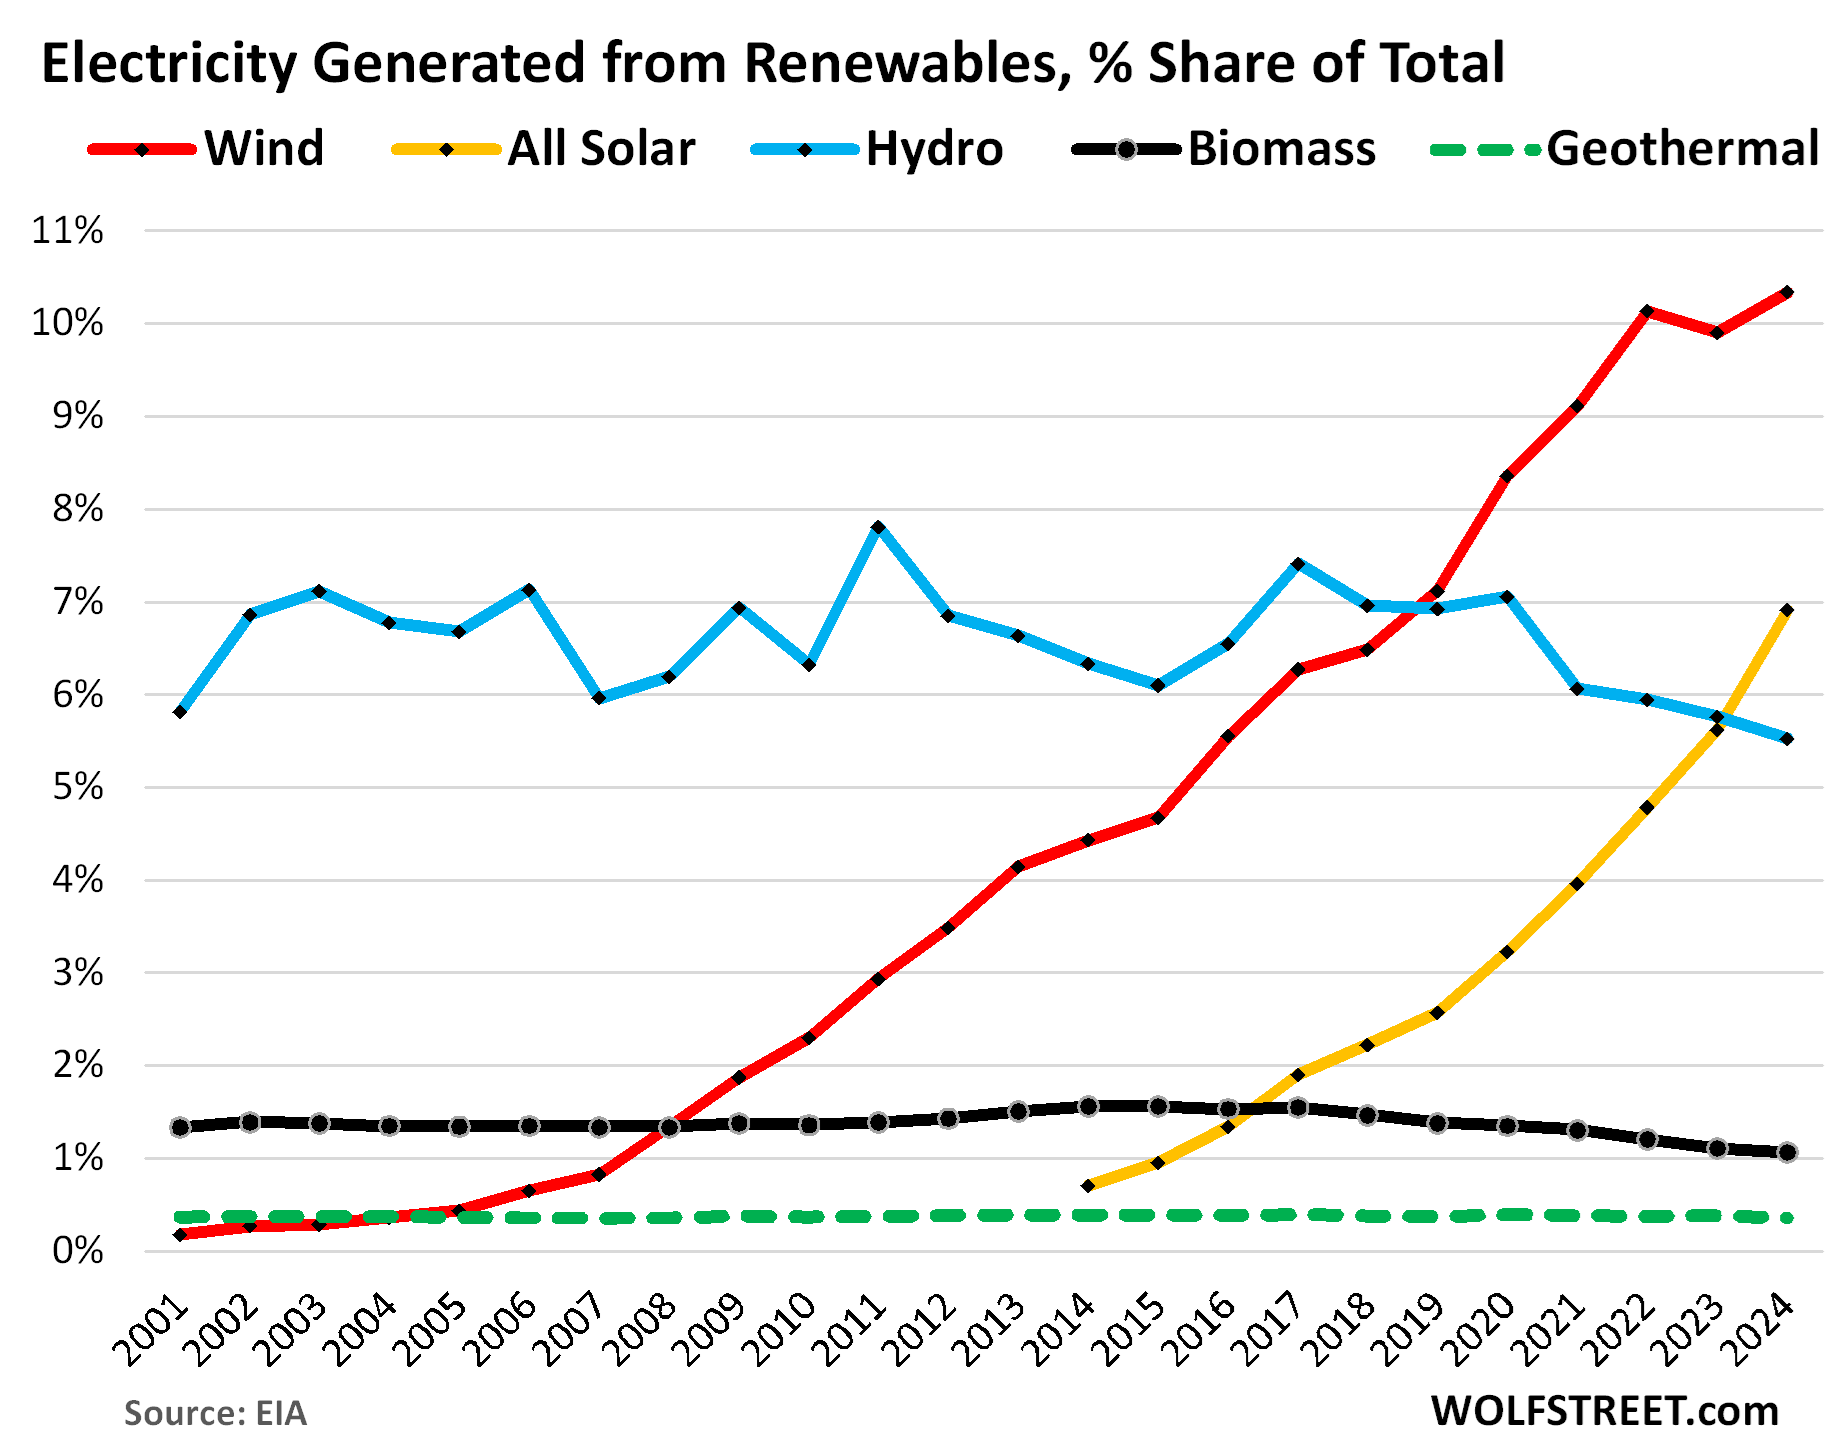
Power Generation from Renewables
Wind power generation jumped by 7.7% in 2024, to a record 453,454 GWh. Its share grew to 10.3% of total power generation (red in the chart below).
The Big Five states for utility-scale wind-power generation in 2023, according to separate EIA data, in GWh and % share of US wind power generation:
- Texas: 119,836 GWh, 28%
- Iowa: 41,869 GWh, 10%
- Oklahoma: 37,731 GWh, 9%
- Kansas: 27,462 GWh, 6.5%
- Illinois: 22,054 GWh, 5%
Solar power generation – utility scale and rooftop solar – surged 26.9% to 303,167 GWh. Its share ballooned to 6.9% of the total power generated, surpassing hydropower (yellow).
Wind and solar combined had a share of 17.2% of total power production in the US, a higher share than coal, and close to nuclear.
Power generation from small-scale solar – such as rooftop systems on homes, retail stores, parking garages, etc. – jumped 15.3% to 84,630 GWh, for a share of 1.9% of total power generated in 2024.
Hydropower generation dipped 1.1% to 242,226 GWh. Its share declined to 5.5% of total power generation (blue).
Biomass power generation declined 1.0% to 46,740 GWh, and its share eased to 1.1% of total power generated. Biomass includes wood and wood-derived fuels, landfill gas, and other waste biomass (black).
Geothermal remained at a minuscule share of 0.4% of total power generated. Most geothermal plants were built in the 1970s in California (green).


Just a point about electricity demand – by far the biggest user of electricity (residential and commercial) is space heating and air con. Annual demand is therefore very weather driven, hence it is unwise to read too much into year by year fluctuations. Deeper demand shifts take several years to become apparent. The ‘flattening out’ of demand seen since the 2008 crash is something that’s been seen in nearly all advanced economies – most likely driven by much greater efficiency in lighting and other plant. It should also be highlighted that increased electricity demand by EV’s represents a significant drop in overall energy use due to the inherently greater efficiency of electric drives. Its not clear (all the major agencies disagree on this), whether increased electrification and data centres will result in a greater level of demand to off-set what seems a long term decline in usage due to efficiency gains and demographic flattening out. Most likely we are at a plateau in the advanced economies.
Increased demand by data centres and crypto, etc., has been rapid and intense but mostly been in regional grids – internationally its not a particularly big driver of demand, and is for the foreseeable future likely to be still a relatively small overall component relative to the ‘big’ users – i.e. heating, cooling, lighting. Getting too hung up on it is a major distraction from the necessity of making these sectors far more efficient (most progress has been on lighting).
A point on natural gas generation – the big driver for natural gas generation was not fracking or ‘efficiency’ as Richter puts it, or even fuel cost. The increase in natural gas use was seen in other countries too, including those without much natural gas. It was an accidental by product of increasing deregulation of grids in the 1990’s, which favoured investments which were relatively low capital input, but which could take advantage of high peak costs. In the UK in the 1990’s it was called the ‘dash for gas’ – entirely accidental, but it devastated the economics of the big thermal plants. The big advantage gas has in a grid over coal (or pretty much anything else), is that its relatively cheap to build a CCGT plant, but even on low usage and high gas prices they can be very profitable as they can supply the highest priced electricity during peak periods, something you can’t do with big thermal plants or (mostly) with renewables. This drove the huge increase in CCGT capacity, which then, when gas prices dropped, meant that it drove the thermal plants out of the market as they were then able to eat into overall demand. This has also had the accidental by-product of making wind and solar more viable, as gas is very effective at load balancing. In many grids now, a combination of renewables and natural gas has made traditional base load thermal plants unnecessary. Thermal plants are now only being built at any scale in countries (like China or Vietnam), where the market has been deliberately unbalanced to encourage investment in excess capacity.
Very insightful comment. I am studying energy use in my municipality in Ontario, Canada. We use a lot of propane for heating but there are few published numbers. As well, there is not much data on heat pump numbers. Do you have any insight into these – not for the specific location, obviously. Propane is a popular choice in rural areas without access to NG infrastructure. It competes with heating oil. Not only are the numbers for propane, heating oil and heat pumps not readily available, neither are their changed – increasing, declining or flat.
I don’t have any great insights into propane use, but in general the ‘wet gases’ like propane or butane are more of an annoyance to the oil/gas industry than any other because of the costs of processing and transport. It’s a byproduct of both oil and gas production. It was mostly burnt off at the wells traditionally, or when possible used for chemical manufacture. There is often a surplus when the oil and gas industry is not allowed burn it off.
It’s often sold under various product names, such as LPG for vehicles (liquified petroleum gas). It’s very popular worldwide for rural cooking/heating, etc., but in general it’s not a cheap option and I think that it is negligible in terms of overall energy usage. Increasingly, cheap solar and batteries makes it less viable for rural housing. Most of the people I know who use it choose it because they prefer gas cookers over electric.
The northeast US uses mostly propane or fuel oil, when you are away from natural gas. It’s very common, and more thought needs to be put into it. I don’t know anyone who tries to heat with electricity. A few have installed heat pumps, but only find them useful for cooling. None depend on them, they can’t afford to.
Current discussion of ‘heating’ completely dismisses this. There are a lot of people thinking you literally want to leave them out in the cold. “let them have electric heat” is not a serious option. Heat pumps aren’t realistic because of the temperature differences. Somewhere south of the Canada-US border heat pumps don’t work anymore, economically and technically. You’re better off with a resistive heater, and it’s way cheaper upfront. But, that’s not dependable. So….propane, or in the old days…fuel oil
DFW- the reason you can’t find those numbers has a lot to do with the fact that no one has much success with the “alternatives”, and they cost a lot up front, so there aren’t many people participating in the sample pool of alternatives. It’s really, really cold in the Northeast!
Coal use for power generation in the United States continued to rise and then rapidly dropped off after 2008. One of the major reasons is because the Obama admin empowered the likes of the Sierra Club to litigate all the power generation companies over its use.
Here is a link to a graph showing coal vs NG starting in 2000.
Coal was already dropping by 2000.
With the steep drop starting in 2008.
https://www.statista.com/chart/23234/coal-and-gas-electricity-output/
Demand drop after 2007 has a conservation component, but much was from plant and facility closures (eg, malls, big box). Commercial and industrial loads collapsed with my transmission utility customers.
The predominant home heating fuel in the US continues to be natural gas. Only in sunbelt states does electricity rise above 50% and that is likely space heaters anf not central heating. For heating I could not find a table expressing watts or joules, but natural gas would certainly dwarf electricity bc of temperature.
In the US massive (1000-1500 MW) CCGT plants running 24/7/365 serve base load. We have several in our region and they predominate in places like FL, TX, LA, etc. These are not peakers, which are ~200MW and adjacent to load centers. And cheap fracked gas certainly is the primary factor which drove the phaseout of coal and some nuclear, with EPA regulations another factor. Coal thermal plants in NY State have been converted to gas for supplying bitcoin and data centers. EIA lists these conversions as of 2020 More than 100 coal-fired plants have been replaced or converted to natural gas since 2011, most in the Eastern US, supplied by fracked gas.
Coincidentally on AP today. These are not “peakers”, rather base load plants. 46GW is a LOT of new construction, equivalent to 40 nuclear plants.
In a reversal, plans for U.S. natural gas power grow, complicating progress on climate
It’s pretty easy to know if they are intended for load or for peaking. They are usually CCGT (or CHP) plants for load, single cycle plants for peaking. Single cycle plants (OCGT) are far cheaper to build, but are less efficient, so not suitable for load.
Hi PK you’re spot on. Too much simplification on electrical loads are just data centers. There is an increase in manufacturing as well as AC units everywhere and EVs etc.
I would add that if you look at the coal vs NG graph’s, yes ng was increasing slightly from 2000 vs the same slight drop in coal.
In the US it was the introduction of fracking under Obama 2008 on, that saw the real increase in ng vs coal. The primary driver was ng was substantially cheaper to buy. And yes with CCGT they get higher efficiency which also adds to the change.
Coal has declined not really because of regulations but due to lower cost of gas.
Something Wolff doesn’t mention is that while we do have a ton of gas we have maxed out many if not most of the gas pipelines across the country.
It’s having a big effect on new CCGT placement, regardless of use of that plant.
I was listening to an energy podcast called open circuit. One of the hosts jijar shah who was the senior finance guy at the dept of energy , super smart, he says and he should know he’s seen the math, that almost all new power costs about $10 per mWh. Gas, nuclear, solar/wind with storage, geothermal.
They talk extensively about the power demands including data centers etc. worth a listen about 30 minutes
Missing from this conversation is distributed energy services, from rooftop solar through community power systems to physical and virtual microgrids, all of which can deliver a full range of energy services (e.g. capacity, reserves, voltage and frequency control, islanding, protection from the long-term planned and unplanned outages that are now routine in private utility systems in places like California).
The potential is huge: for example, the cost-effective rooftop and parking lot solar and battery storage energy production potential, after subtracting for shading and roofs pointing the wrong way to exceeds the current *energy* (not capacity, which often sounds like more energy than it is for solar and wind) in California far exceeds the energy production of the entire existing California grid. And, you don’t get battery fires that contaminate Monterey Bay, or fires caused by transmission lines that burn entire cities to the ground. And, you don’t have to pay tens of billions of dollars to build more transmission lines so that you can pave over open space with solar panels – building on top of the existing human footprint, right where the power is needed, is much cheaper to do. And the money stays in communities. Done right, distributed energy community energy and power co-ops can do much more to reduce energy costs for low income families than bogus, intrusive “discount” programs which simply transfer who pays the bill to utility private equity and pension fund owners (not unlike Obamacare, except worse).
The fundamental problem with distributed renewable energy services, and the reason why they aren’t even on the table, is that they threaten predatory private utility profits.
Great comment.